How to Make Plots
Note
In this document, and the rest of the yt documentation, we use field tuples;
for instance, we specify density as ("gas", "density") whereas in
previous versions of this document we typically just used "density".
While the latter will still work in many or most cases, and may suffice for
your purposes, for ensuring we explicitly avoid ambiguity we use field tuples
here.
In this section we explain how to use yt to create visualizations of simulation data, derived fields, and the data produced by yt analysis objects. For details about the data extraction and algorithms used to produce the image and analysis data, please see the yt method paper. There are also many example scripts in The Cookbook.
The PlotWindow interface is useful for
taking a quick look at simulation outputs. Simple mechanisms exist for making
plots of slices, projections, 1D spatial line plots, 1D profiles, and 2D
profiles (phase plots), all of which are described below.
Viewing Plots
yt uses an environment neutral plotting mechanism that detects the appropriate
matplotlib configuration for a given environment, however it defaults to a basic
renderer. To utilize interactive plots in matplotlib supported
environments (Qt, GTK, WX, etc.) simply call the toggle_interactivity() function. Below is an
example in a jupyter notebook environment, but the same command should work
in other environments as well:
%matplotlib notebook
import yt
yt.toggle_interactivity()
Slices & Projections
If you need to take a quick look at a single simulation output, yt
provides the PlotWindow interface for
generating annotated 2D visualizations of simulation data. You can create a
PlotWindow plot by
supplying a dataset, a list of fields to plot, and a plot center to
create a AxisAlignedSlicePlot,
OffAxisSlicePlot,
ProjectionPlot, or
OffAxisProjectionPlot.
Plot objects use yt data objects to extract the maximum resolution
data available to render a 2D image of a field. Whenever a
two-dimensional image is created, the plotting object first obtains
the necessary data at the highest resolution. Every time an image
is requested of it – for instance, when the width or field is changed
– this high-resolution data is then pixelized and placed in a buffer
of fixed size. This is accomplished behind the scenes using
FixedResolutionBuffer.
The PlotWindow class exposes the
underlying matplotlib
figure
and axes
objects, making it easy to customize your plots and
add new annotations. See Further customization via matplotlib for more information.
Slice Plots
The quickest way to plot a slice of a field through your data is via
SlicePlot. These plots are generally
quicker than projections because they only need to read and process a slice
through the dataset.
The following script plots a slice through the density field along the z-axis
centered on the center of the simulation box in a simulation dataset we’ve
opened and stored in ds:
slc = yt.SlicePlot(ds, "z", ("gas", "density"))
slc.save()
These two commands will create a slice object and store it in a variable we’ve
called slc. Since this plot is aligned with the simulation coordinate
system, slc is an instance of
AxisAlignedSlicePlot. We then call the
save() function, which automatically saves the plot in png image format with
an automatically generated filename. If you don’t want the slice object to
stick around, you can accomplish the same thing in one line:
yt.SlicePlot(ds, "z", ("gas", "density")).save()
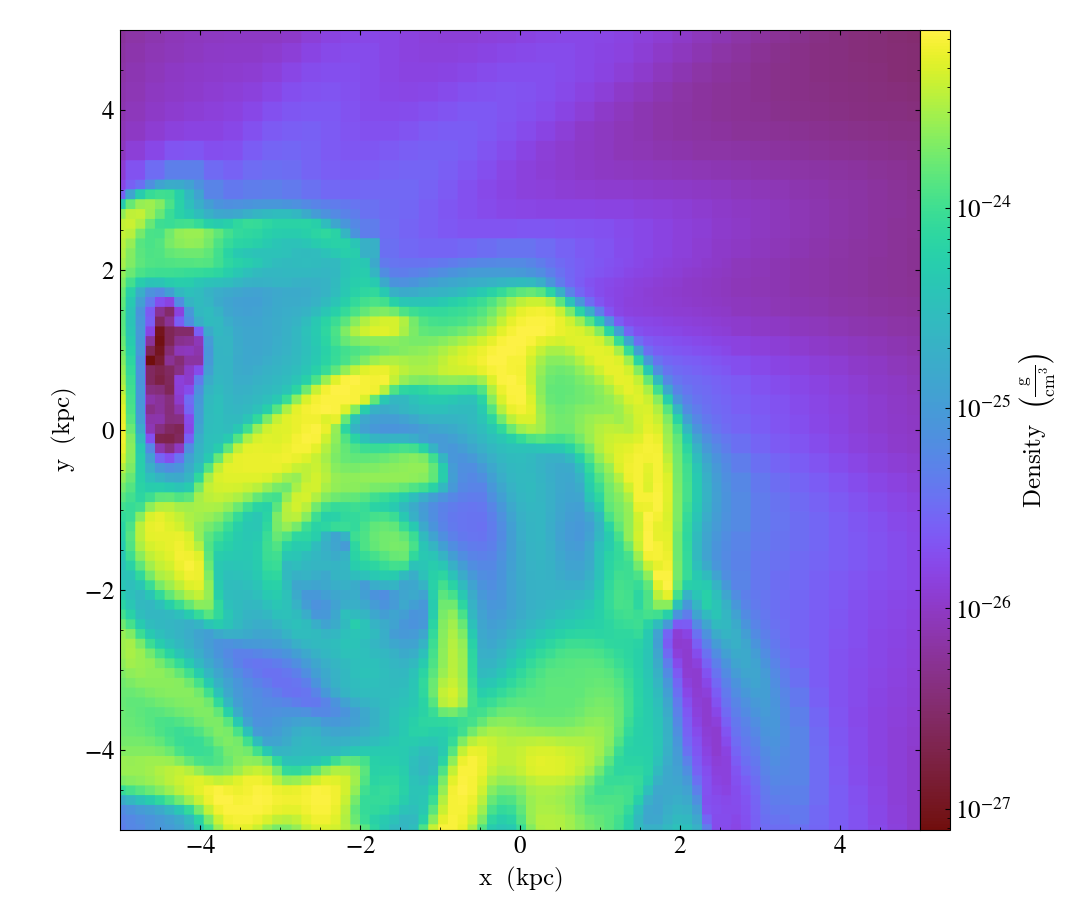
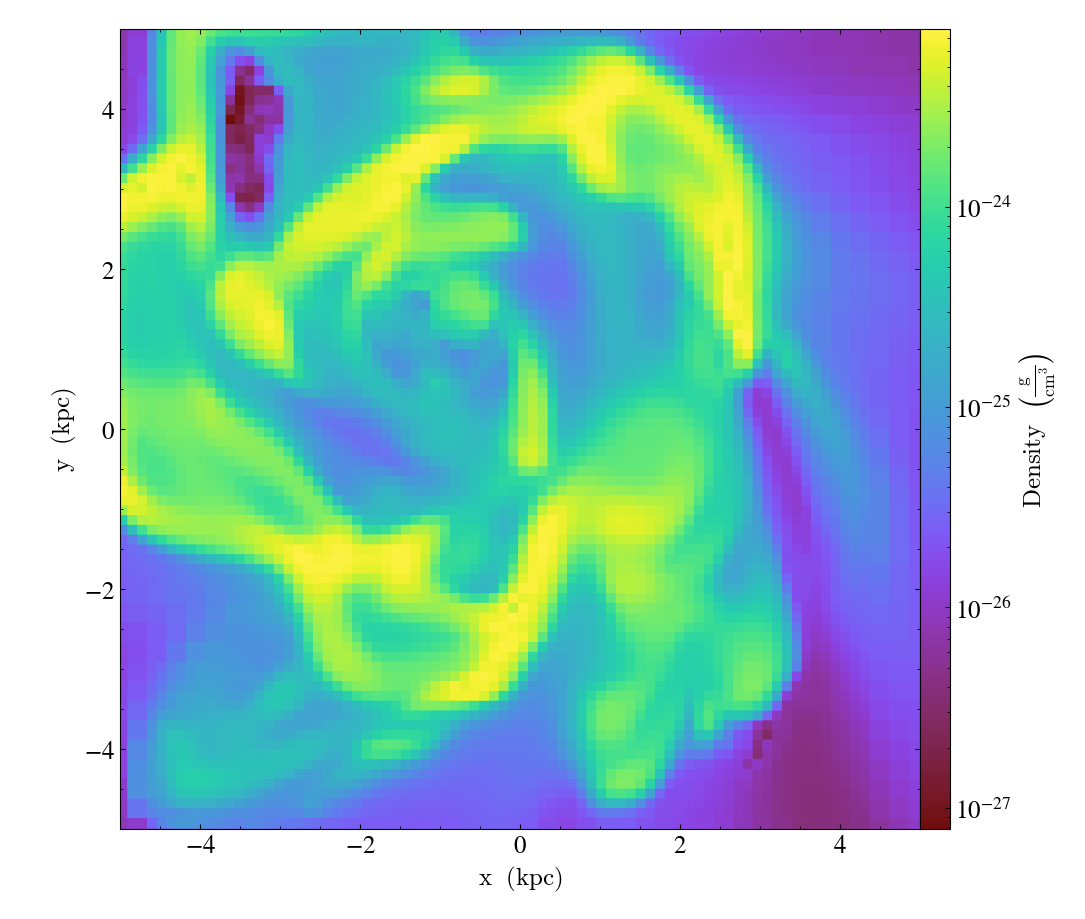
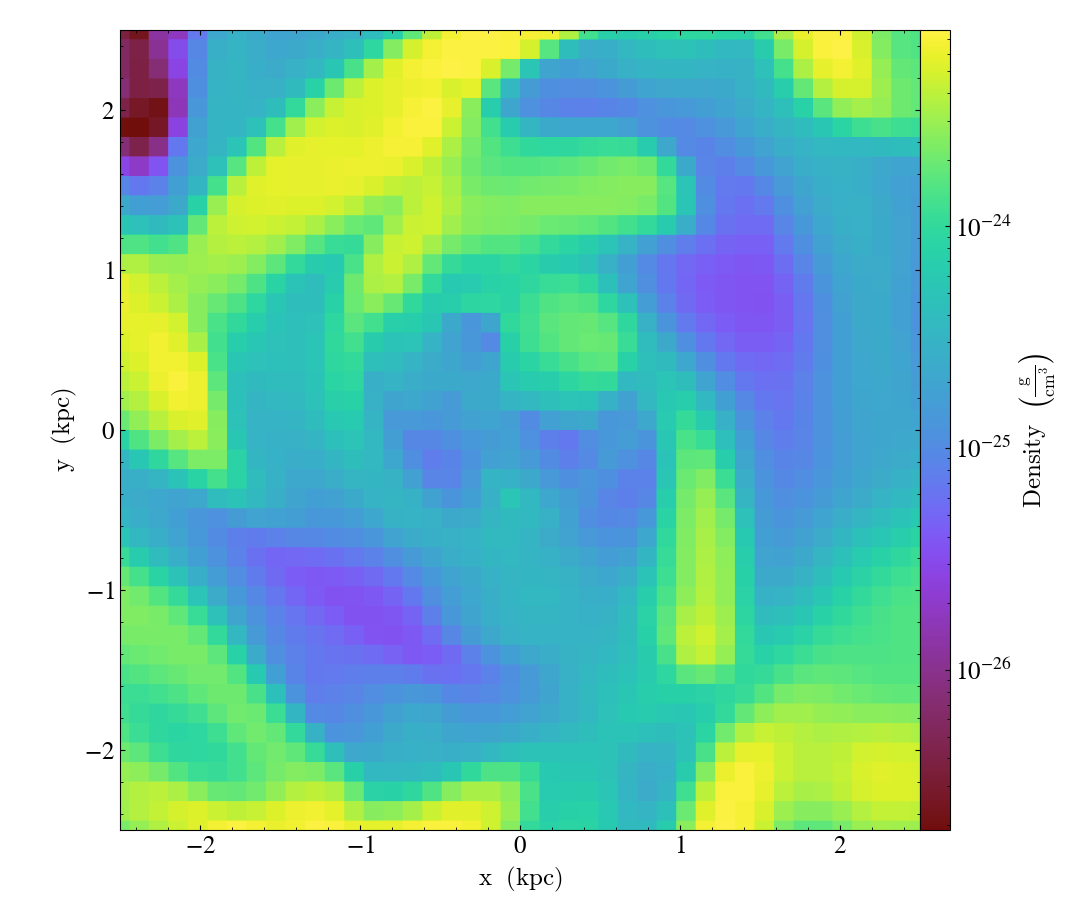
It’s nice to keep the slice object around if you want to modify the plot. By default, the plot width will be set to the size of the simulation box. To zoom in by a factor of ten, you can call the zoom function attached to the slice object:
slc = yt.SlicePlot(ds, "z", ("gas", "density"))
slc.zoom(10)
slc.save("zoom")
This will save a new plot to disk with a different filename - prepended with
‘zoom’ instead of the name of the dataset. If you want to set the width
manually, you can do that as well. For example, the following sequence of
commands will create a slice, set the width of the plot to 10 kiloparsecs, and
save it to disk, with the filename prefix being 10kpc and the rest determined
by the field, visualization method, etc.
from yt.units import kpc

slc = yt.SlicePlot(ds, "z", ("gas", "density"))
slc.set_width(10 * kpc)
slc.save("10kpc")
The plot width can be specified independently along the x and y direction by
passing a tuple of widths. An individual width can also be represented using a
(value, unit) tuple. The following sequence of commands all equivalently
set the width of the plot to 200 kiloparsecs in the x and y direction.
from yt.units import kpc

slc.set_width(200 * kpc)
slc.set_width((200, "kpc"))
slc.set_width((200 * kpc, 200 * kpc))
The SlicePlot also optionally accepts the coordinate to center the plot on
and the width of the plot:
yt.SlicePlot(
    ds, "z", ("gas", "density"), center=[0.2, 0.3, 0.8], width=(10, "kpc")
).save()
Note that, by default,
SlicePlot shifts the
coordinates on the axes such that the origin is at the center of the
slice. To instead use the coordinates as defined in the dataset, use
the optional argument: origin="native"
If supplied without units, the center is assumed by in code units. There are also
the following alternative options for the center keyword:
"center","c": the domain center"left","l","right""r": the domain’s left/right edge along the normal direction (SlicePlot’s second argument). Remaining axes use their respective domain center values."min": the position of the minimum density"max","m": the position of the maximum density"min/max_<field name>": the position of the minimum/maximum in the first field matching field name("min", field): the position of the minimum offield("max", field): the position of the maximum offield
where for the last two objects any spatial field, such as "density",
"velocity_z",
etc., may be used, e.g. center=("min", ("gas", "temperature")).
"left" and "right" are not allowed for off-axis slices.
The effective resolution of the plot (i.e. the number of resolution elements
in the image itself) can be controlled with the buff_size argument:
yt.SlicePlot(ds, "z", ("gas", "density"), buff_size=(1000, 1000))
Here is an example that combines all of the options we just discussed.
import yt
from yt.units import kpc

ds = yt.load("IsolatedGalaxy/galaxy0030/galaxy0030")
slc = yt.SlicePlot(
    ds,
    "z",
    ("gas", "density"),
    center=[0.5, 0.5, 0.5],
    width=(20, "kpc"),
    buff_size=(1000, 1000),
)
slc.save()
The above example will display an annotated plot of a slice of the Density field in a 20 kpc square window centered on the coordinate (0.5, 0.5, 0.5) in the x-y plane. The axis to slice along is keyed to the letter ‘z’, corresponding to the z-axis. Finally, the image is saved to a png file.
Conceptually, you can think of the plot object as an adjustable window into the data. For example:
import yt

ds = yt.load("IsolatedGalaxy/galaxy0030/galaxy0030")
slc = yt.SlicePlot(ds, "z", ("gas", "pressure"), center="c")
slc.save()
slc.zoom(30)
slc.save("zoom")
will save a plot of the pressure field in a slice along the z axis across the entire simulation domain followed by another plot that is zoomed in by a factor of 30 with respect to the original image. Both plots will be centered on the center of the simulation box. With these sorts of manipulations, one can easily pan and zoom onto an interesting region in the simulation and adjust the boundaries of the region to visualize on the fly.
If you want to slice through a subset of the full dataset volume,
you can use the data_source keyword with a data object
or a cut region.
See AxisAlignedSlicePlot for the
full class description.
Plots of 2D Datasets
If you have a two-dimensional cartesian, cylindrical, or polar dataset,
plot_2d() is a way to make a plot
within the dataset’s plane without having to specify the axis, which
in this case is redundant. Otherwise, plot_2d accepts the same
arguments as SlicePlot. The one other difference is that the
center keyword argument can be a two-dimensional coordinate instead
of a three-dimensional one:
import yt

ds = yt.load("WindTunnel/windtunnel_4lev_hdf5_plt_cnt_0030")
p = yt.plot_2d(ds, ("gas", "density"), center=[1.0, 0.4])
p.set_log(("gas", "density"), False)
p.save()
See plot_2d() for the full description
of the function and its keywords.
Off Axis Slices
Off axis slice plots can be generated in much the same way as
grid-aligned slices. Off axis slices use
YTCuttingPlane to slice
through simulation domains at an arbitrary oblique angle. A
OffAxisSlicePlot can be
instantiated by specifying a dataset, the normal to the cutting
plane, and the name of the fields to plot. Just like an
AxisAlignedSlicePlot, an
OffAxisSlicePlot can be created via the
SlicePlot class. For example:
import yt

ds = yt.load("IsolatedGalaxy/galaxy0030/galaxy0030")
L = [1, 1, 0]  # vector normal to cutting plane
north_vector = [-1, 1, 0]
cut = yt.SlicePlot(ds, L, ("gas", "density"), width=(25, "kpc"), north_vector=north_vector)
cut.save()
In this case, a normal vector for the cutting plane is supplied in the second
argument. Optionally, a north_vector can be specified to fix the orientation
of the image plane.
Note
Not every data types have support for off-axis slices yet. Currently, this operation is supported for grid based and SPH data with cartesian geometry. In some cases an off-axis projection over a thin region might be used instead.
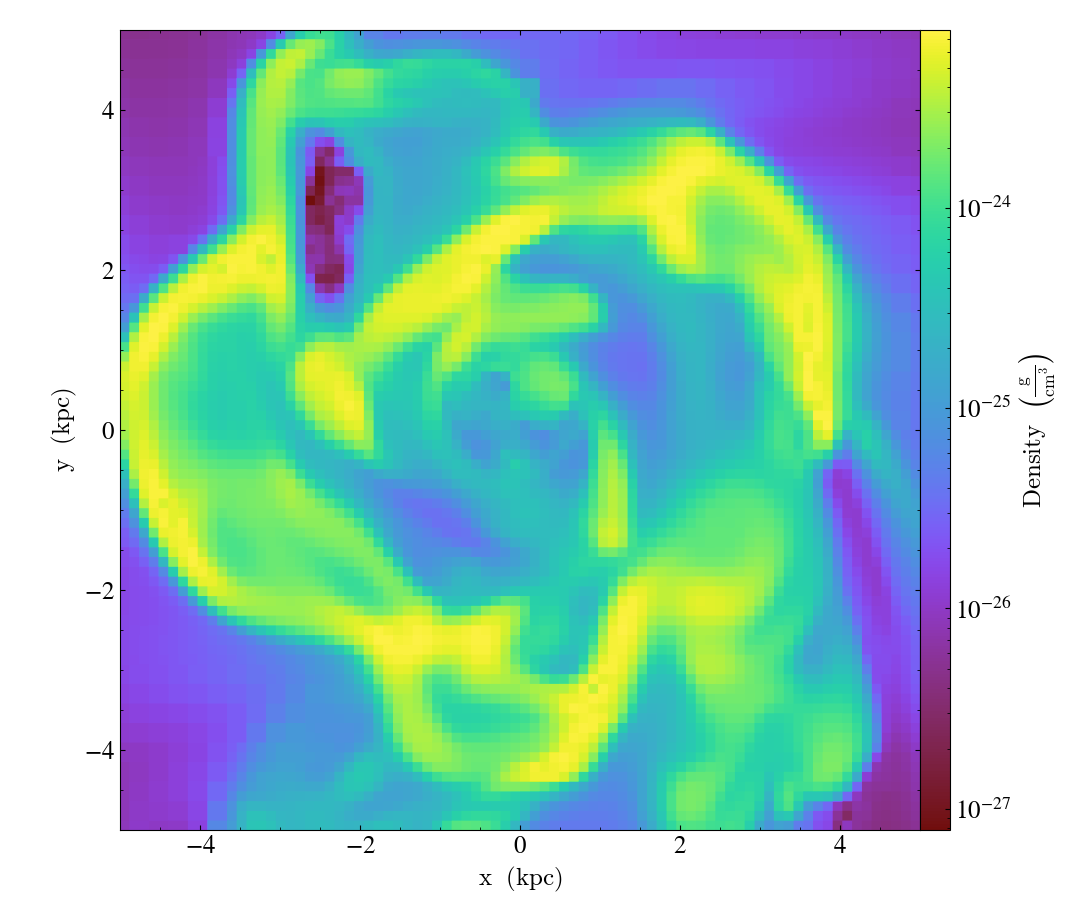
Projection Plots
Using a fast adaptive projection, yt is able to quickly project simulation data along the coordinate axes.
Projection plots are created by instantiating a
ProjectionPlot object. For
example:
import yt
from yt.units import kpc

ds = yt.load("IsolatedGalaxy/galaxy0030/galaxy0030")
prj = yt.ProjectionPlot(
    ds,
    "z",
    ("gas", "temperature"),
    width=25 * kpc,
    weight_field=("gas", "density"),
    buff_size=(1000, 1000),
)
prj.save()
will create a density-weighted projection of the temperature field along the x axis with 1000 resolution elements per side, plot it, and then save the plot to a png image file.
Like Slice Plots, annotations and modifications can be applied
after creating the ProjectionPlot object. Annotations are
described in Plot Modifications: Overplotting Contours, Velocities, Particles, and More. See
ProjectionPlot for the full
class description.
If you want to project through a subset of the full dataset volume,
you can use the data_source keyword with a data object.
The Thin-Slice Projections recipes demonstrates this functionality.
Note
Not every data types have support for off-axis projections yet. Currently, this operation is supported for grid based data with cartesian geometry, as well as SPH particles data.
Types of Projections
There are several different methods of projections that can be made either
when creating a projection with proj() or
when making a ProjectionPlot.
In either construction method, set the method keyword to be one of the
following:
integrate (unweighted):
This is the default projection method. It simply integrates the requested field \(f({\bf x})\) along a line of sight \(\hat{\bf n}\) , given by the axis parameter (e.g. \(\hat{\bf i},\hat{\bf j},\) or \(\hat{\bf k}\)). The units of the projected field \(g({\bf X})\) will be the units of the unprojected field \(f({\bf x})\) multiplied by the appropriate length unit, e.g., density in \(\mathrm{g\ cm^{-3}}\) will be projected to \(\mathrm{g\ cm^{-2}}\).
integrate (weighted):
When using the integrate method, a weight_field argument may also
be specified, which will produce a weighted projection. \(w({\bf x})\)
is the field used as a weight. One common example would
be to weight the “temperature” field by the “density” field. In this case,
the units of the projected field are the same as the unprojected field.
where the “~” over \(w({\bf x})\) reflects the fact that it has been normalized like so:
For weighted projections using the integrate method, it is also possible
to project the standard deviation of a field. In this case, the projected
field is mathematically given by:
in order to make a weighted projection of the standard deviation of a field
along a line of sight, the moment keyword argument should be set to 2.
max:
This method picks out the maximum value of a field along the line of sight given by the axis parameter.
min:
This method picks out the minimum value of a field along the line of sight given by the axis parameter.
sum:
This method is the same as integrate, except that it does not
multiply by a path length when performing the integration, and is just a
straight summation of the field along the given axis. The units of the
projected field will be the same as those of the unprojected field. This
method is typically only useful for datasets such as 3D FITS cubes where
the third axis of the dataset is something like velocity or frequency, and
should only be used with fixed-resolution grid-based datasets.
Off Axis Projection Plots
Internally, off axis projections are created using Camera
by applying the
ProjectionTransferFunction.
In this use case, the volume renderer casts a set of plane parallel rays, one
for each pixel in the image. The data values along each ray are summed,
creating the final image buffer.
For SPH datsets, the coordinates are instead simply rotated before the axis-aligned
projection function is applied.
To avoid manually creating a camera and setting the transfer
function, yt provides the
off_axis_projection()
function, which wraps the camera interface to create an off axis
projection image buffer. These images can be saved to disk or
used in custom plots. This snippet creates an off axis
projection through a simulation.
import numpy as np

import yt

ds = yt.load("IsolatedGalaxy/galaxy0030/galaxy0030")
L = [1, 1, 0]  # vector normal to cutting plane
W = [0.02, 0.02, 0.02]
c = [0.5, 0.5, 0.5]
N = 512
image = yt.off_axis_projection(ds, c, L, W, N, ("gas", "density"))
yt.write_image(np.log10(image), "%s_offaxis_projection.png" % ds)
Here, W is the width of the projection in the x, y, and z
directions.
One can also generate annotated off axis projections using
ProjectionPlot. These
plots can be created in much the same way as an
OffAxisSlicePlot, requiring only an open dataset, a direction
to project along, and a field to project. For example:
import yt

ds = yt.load("IsolatedGalaxy/galaxy0030/galaxy0030")
L = [1, 1, 0]  # vector normal to cutting plane
north_vector = [-1, 1, 0]
prj = yt.ProjectionPlot(
    ds, L, ("gas", "density"), width=(25, "kpc"), north_vector=north_vector
)
prj.save()
OffAxisProjectionPlot objects can also be created with a number of
keyword arguments, as described in
OffAxisProjectionPlot.
Like on-axis projections, the projection of the standard deviation
of a weighted field can be created by setting moment=2 in the call
to ProjectionPlot.
Slice Plots and Projection Plots in Spherical Geometry
What to expect when plotting data in spherical geometry? Here we explain the notations and projections system yt uses for to render 2D images of spherical data.
The native spherical coordinates are
the spherical radius \(r\)
the colatitude \(\theta\), defined between \(0\) and \(\pi\)
the azimuth \(\varphi\), defined between \(0\) and \(2\pi\)
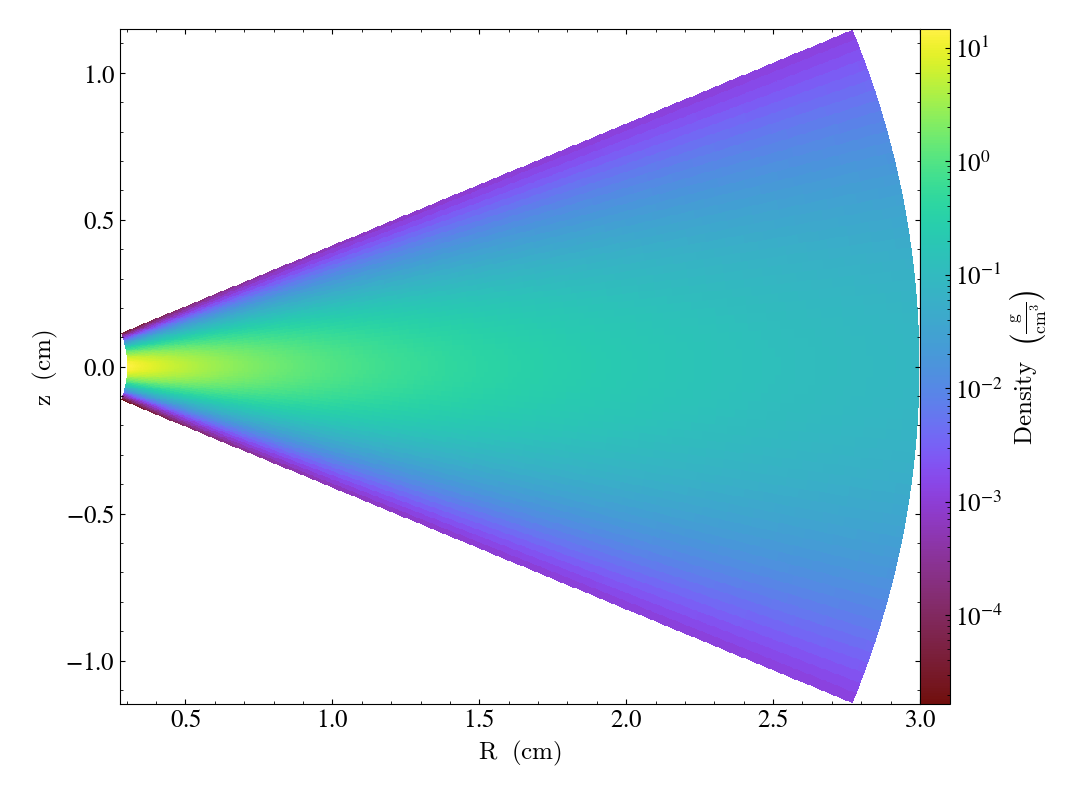
\(\varphi\)-normal slices are represented in the poloidal plane, with axes \(R, z\), where
\(R = r \sin \theta\) is the cylindrical radius
\(z = r \cos \theta\) is the elevation
import yt

ds = yt.load_sample("KeplerianDisk", unit_system="cgs")
slc = yt.SlicePlot(ds, "phi", ("gas", "density"))
slc.save()
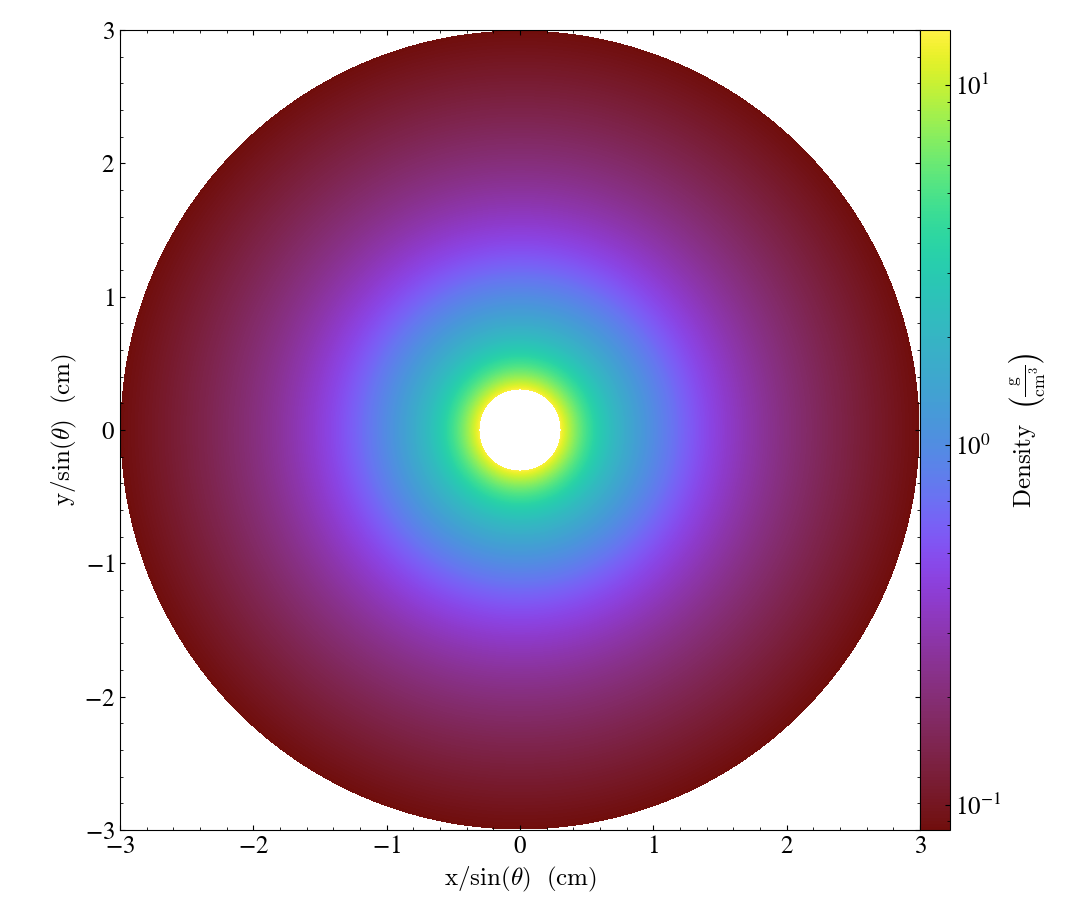
\(\theta\)-normal slices are represented in a \(x/\sin(\theta)\) VS \(y/\sin(\theta)\) plane, where
\(x = R \cos \varphi\)
\(y = R \sin \varphi\)
are the cartesian plane coordinates
import yt

ds = yt.load_sample("KeplerianDisk", unit_system="cgs")
slc = yt.SlicePlot(ds, "theta", ("gas", "density"))
slc.save()
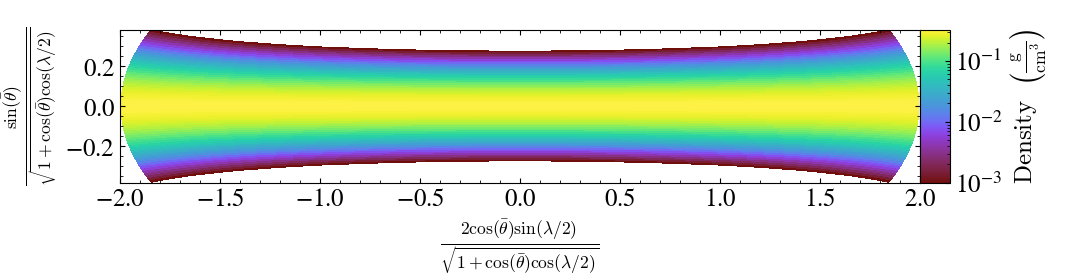
Finally, \(r\)-normal slices are represented following a Aitoff-Hammer projection
We denote
the latitude \(\bar\theta = \frac{\pi}{2} - \theta\)
the longitude \(\lambda = \varphi - \pi\)
import yt

ds = yt.load_sample("KeplerianDisk", unit_system="cgs")
slc = yt.SlicePlot(ds, "r", ("gas", "density"))
slc.save()
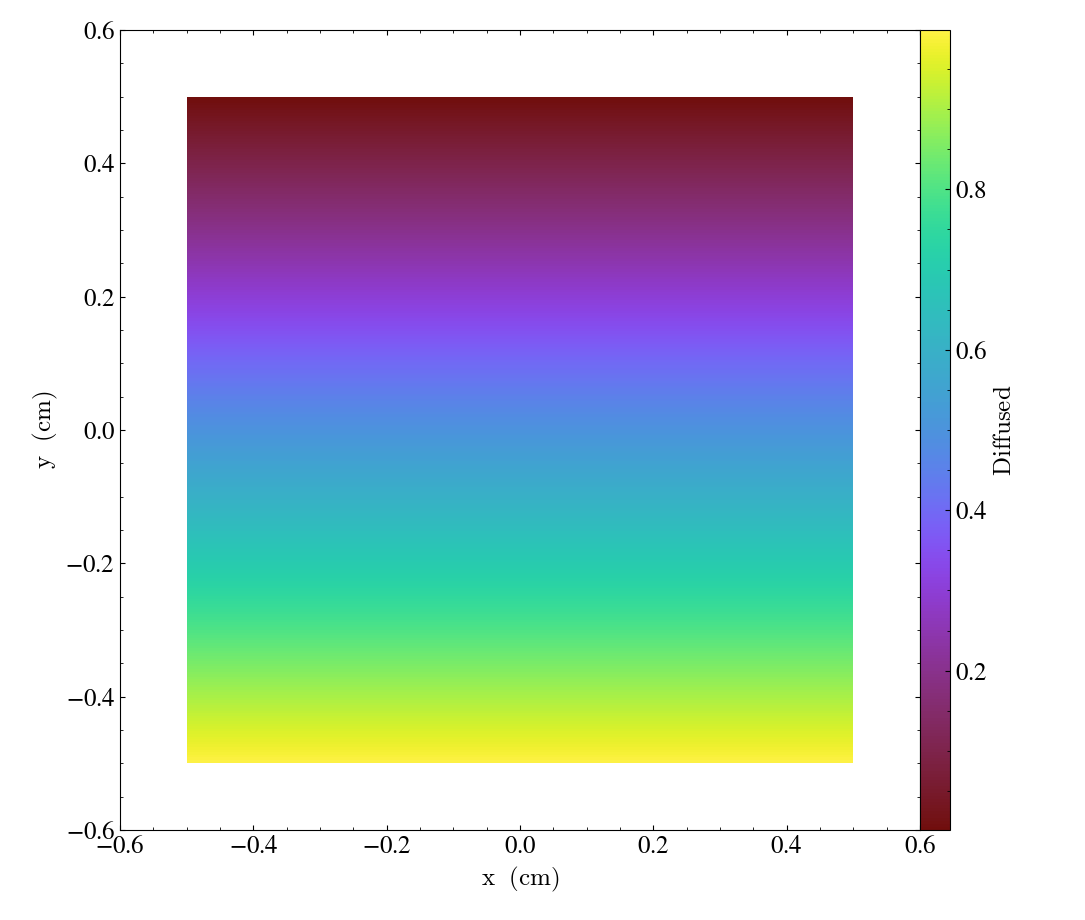
Unstructured Mesh Slices
Unstructured Mesh datasets can be sliced using the same syntax as above. Here is an example script using a publicly available MOOSE dataset:
import yt

ds = yt.load("MOOSE_sample_data/out.e-s010")
sl = yt.SlicePlot(ds, "x", ("connect1", "diffused"))
sl.zoom(0.75)
sl.save()
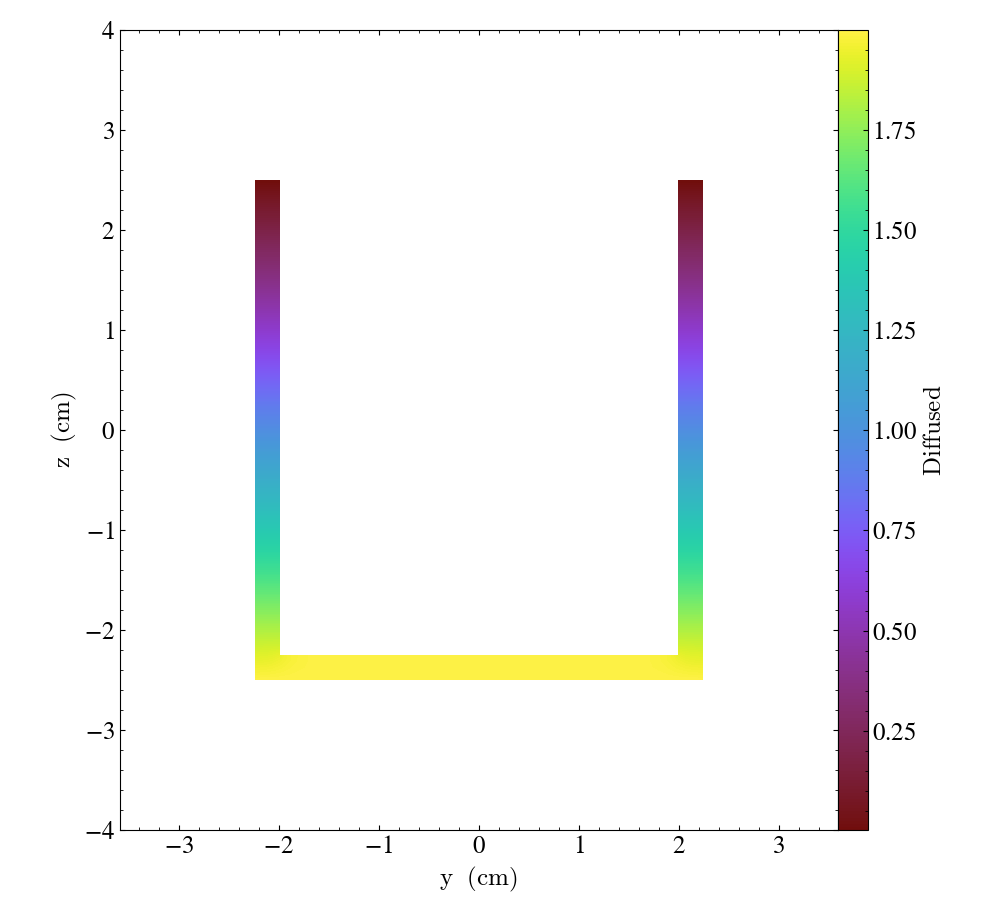
Here, we plot the 'diffused' variable, using a slice normal to the 'x' direction,
through the meshed labelled by 'connect1'. By default, the slice goes through the
center of the domain. We have also zoomed out a bit to get a better view of the
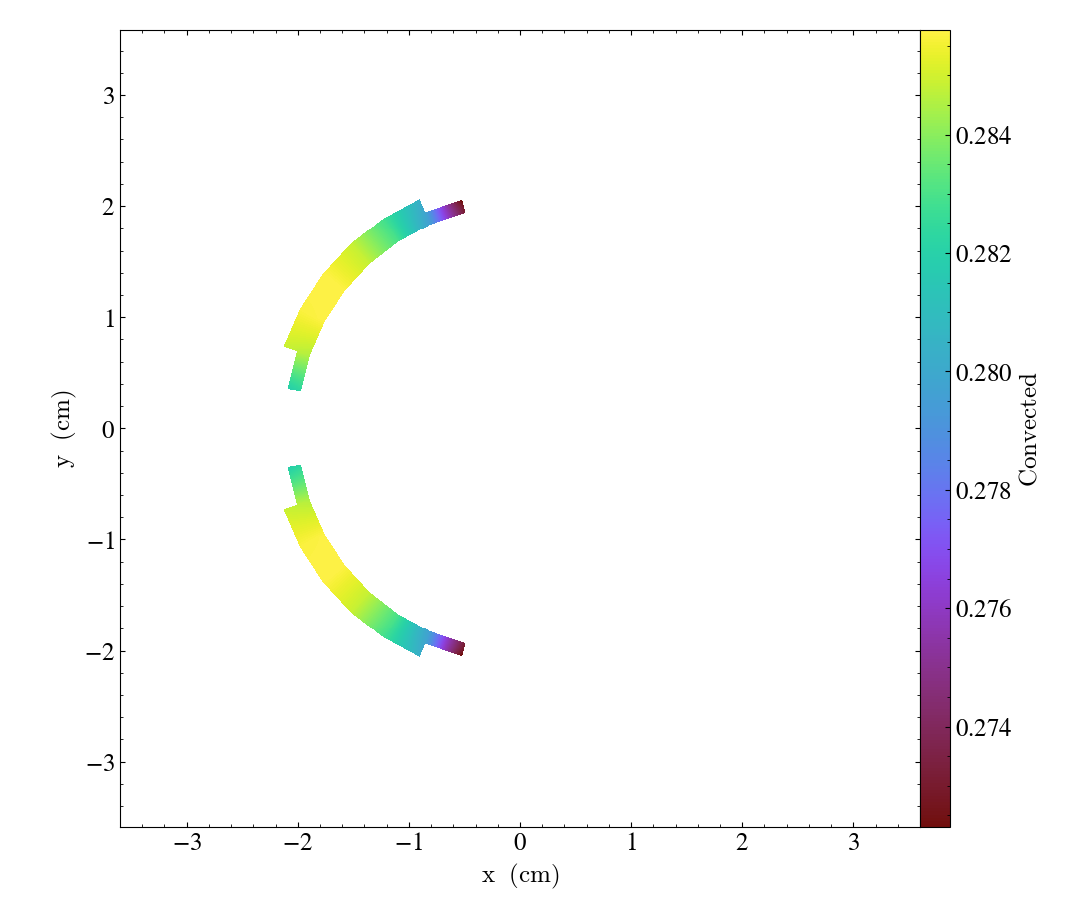
resulting structure. To instead plot the 'convected' variable, using a slice normal
to the 'z' direction through the mesh labelled by 'connect2', we do:
import yt

ds = yt.load("MOOSE_sample_data/out.e-s010")
sl = yt.SlicePlot(ds, "z", ("connect2", "convected"))
sl.zoom(0.75)
sl.save()
These slices are made by sampling the finite element solution at the points corresponding
to each pixel of the image. The 'convected' and 'diffused' variables are node-centered,
so this interpolation is performed by converting the sample point the reference coordinate
system of the element and evaluating the appropriate shape functions. You can also
plot element-centered fields:
import yt
ds = yt.load("MOOSE_sample_data/out.e-s010")
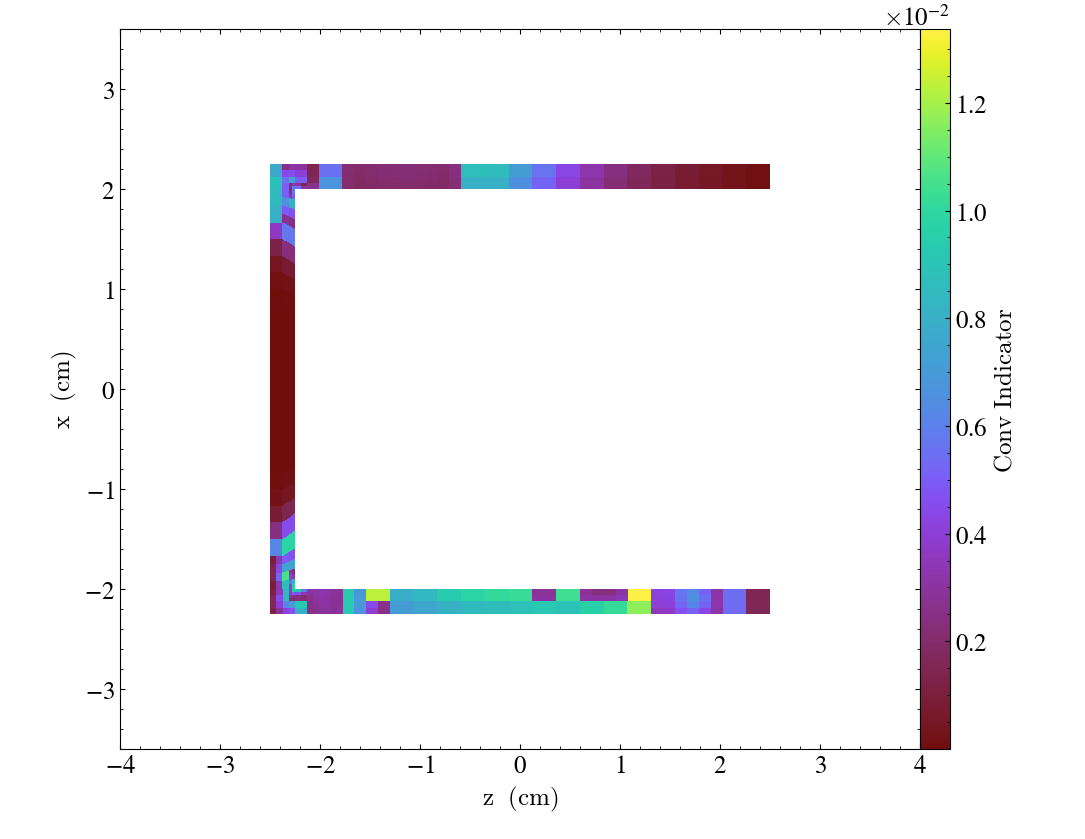
sl = yt.SlicePlot(ds, "y", ("connect1", "conv_indicator"))
sl.zoom(0.75)
sl.save()
We can also annotate the mesh lines, as follows:
import yt

ds = yt.load("MOOSE_sample_data/out.e-s010")
sl = yt.SlicePlot(ds, "z", ("connect1", "diffused"))
sl.annotate_mesh_lines(color="black")
sl.zoom(0.75)
sl.save()
The plot_args parameter is a dictionary of keyword arguments that will be passed
to matplotlib. It can be used to control the mesh line color, thickness, etc…
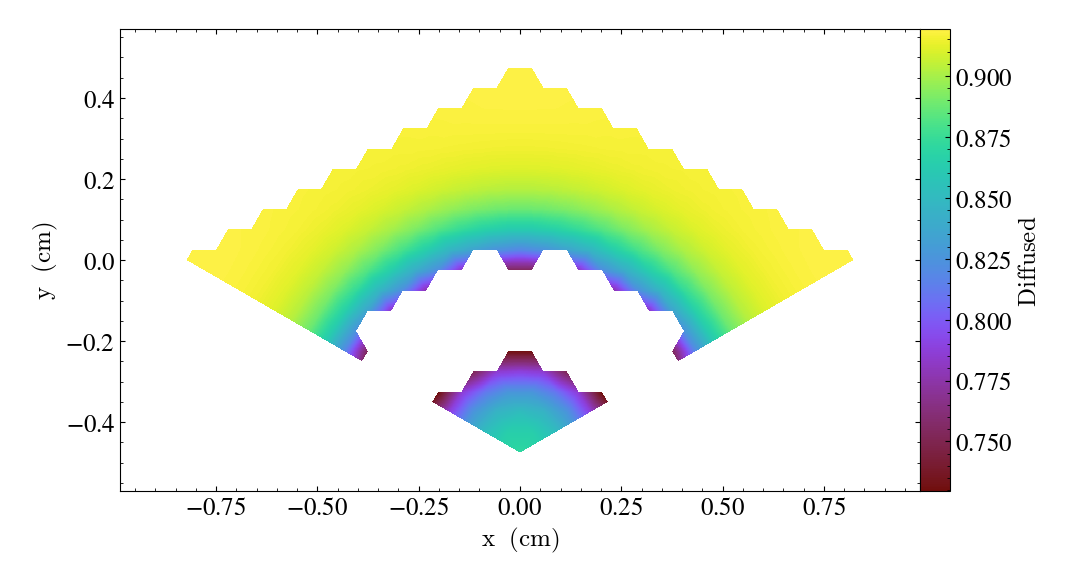
The above examples all involve 8-node hexahedral mesh elements. Here is another example from a dataset that uses 6-node wedge elements:
import yt

ds = yt.load("MOOSE_sample_data/wedge_out.e")
sl = yt.SlicePlot(ds, "z", ("connect2", "diffused"))
sl.save()
Slices can also be used to examine 2D unstructured mesh datasets, but the
slices must be taken to be normal to the 'z' axis, or you’ll get an error. Here is
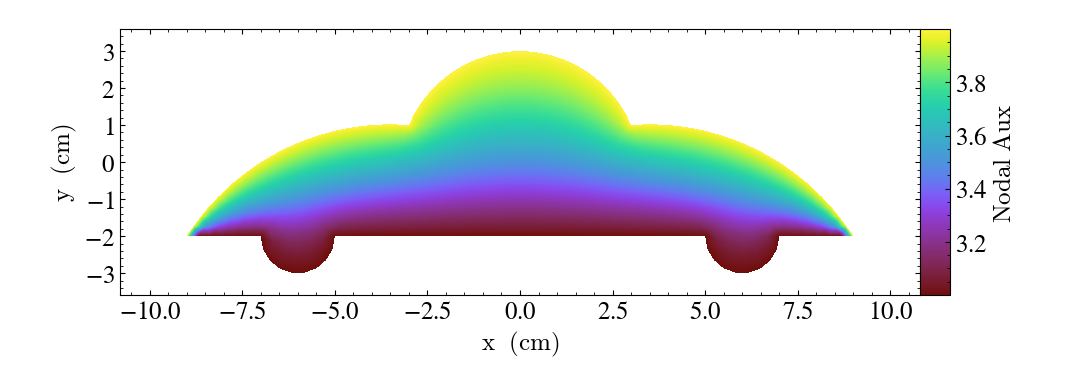
an example using another MOOSE dataset that uses triangular mesh elements:
import yt

ds = yt.load("MOOSE_sample_data/out.e")
sl = yt.SlicePlot(ds, "z", ("connect1", "nodal_aux"))
sl.save()
You may run into situations where you have a variable you want to visualize that
exists on multiple mesh blocks. To view the variable on all mesh blocks,
simply pass all as the first argument of the field tuple:
import yt

ds = yt.load("MultiRegion/two_region_example_out.e", step=-1)
sl = yt.SlicePlot(ds, "z", ("all", "diffused"))
sl.save()
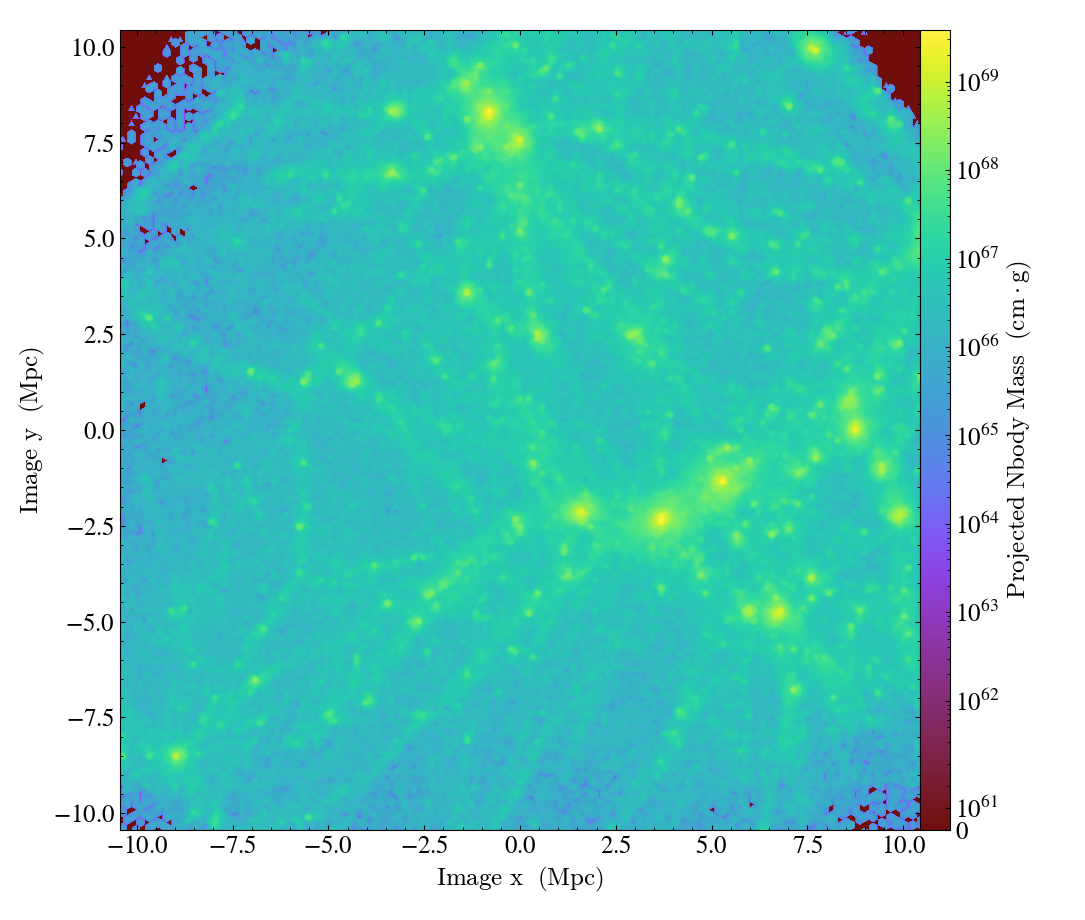
Additional Notes for Plotting Particle Data
Since version 4.2.0, off-axis projections ares supported for non-SPH particle data. Previous to that, this operation was only supported for SPH particles. Two historical workaround methods were available for plotting non-SPH particles with off-axis projections.
Adding Smoothing Lengths for Non-SPH Particles - this method involves extracting particle data to be reloaded with
load_particlesand using theadd_sph_fieldsfunction to create smoothing lengths. This works well for relatively small datasets, but is not parallelized and may take too long for larger data.Plot from a saved
YTCoveringGrid,YTSmoothedCoveringGrid, orYTArbitraryGriddataset.
This second method is illustrated below. First, construct one of the grid data
objects listed above. Then, use the
save_as_dataset
function (see Saving Reloadable Data) to save a deposited particle field
(see Deposited Particle Fields) as a reloadable dataset. This dataset
can then be loaded and visualized using both off-axis projections and slices.
Note, the change in the field name from ("deposit", "nbody_mass") to
("grid", "nbody_mass") after reloading.
import yt

ds = yt.load("gizmo_cosmology_plus/snap_N128L16_132.hdf5")
# create a 128^3 covering grid over the entire domain
L = 7
cg = ds.covering_grid(level=L, left_edge=ds.domain_left_edge, dims=[2**L]*3)

fn = cg.save_as_dataset(fields=[("deposit", "nbody_mass")])
ds_grid = yt.load(fn)
p = yt.ProjectionPlot(ds_grid, [1, 1, 1], ("grid", "nbody_mass"))
p.save()
Plot Customization: Recentering, Resizing, Colormaps, and More
You can customize each of the four plot types above in identical ways. We’ll go over each of the customizations methods below. For each of the examples below we will modify the following plot.
import yt

ds = yt.load("IsolatedGalaxy/galaxy0030/galaxy0030")
slc = yt.SlicePlot(ds, "z", ("gas", "density"), width=(10, "kpc"))
slc.save()
Panning and zooming
There are three methods to dynamically pan around the data.
pan() accepts x and y
deltas.
import yt
from yt.units import kpc

ds = yt.load("IsolatedGalaxy/galaxy0030/galaxy0030")
slc = yt.SlicePlot(ds, "z", ("gas", "density"), width=(10, "kpc"))
slc.pan((2 * kpc, 2 * kpc))
slc.save()
pan_rel() accepts deltas
in units relative to the field of view of the plot.
import yt

ds = yt.load("IsolatedGalaxy/galaxy0030/galaxy0030")
slc = yt.SlicePlot(ds, "z", ("gas", "density"), width=(10, "kpc"))
slc.pan_rel((0.1, -0.1))
slc.save()
zoom() accepts a factor to zoom in by.
import yt

ds = yt.load("IsolatedGalaxy/galaxy0030/galaxy0030")
slc = yt.SlicePlot(ds, "z", ("gas", "density"), width=(10, "kpc"))
slc.zoom(2)
slc.save()
Set axes units
set_axes_unit() allows the customization of
the axes unit labels.
import yt

ds = yt.load("IsolatedGalaxy/galaxy0030/galaxy0030")
slc = yt.SlicePlot(ds, "z", ("gas", "density"), width=(10, "kpc"))
slc.set_axes_unit("Mpc")
slc.save()
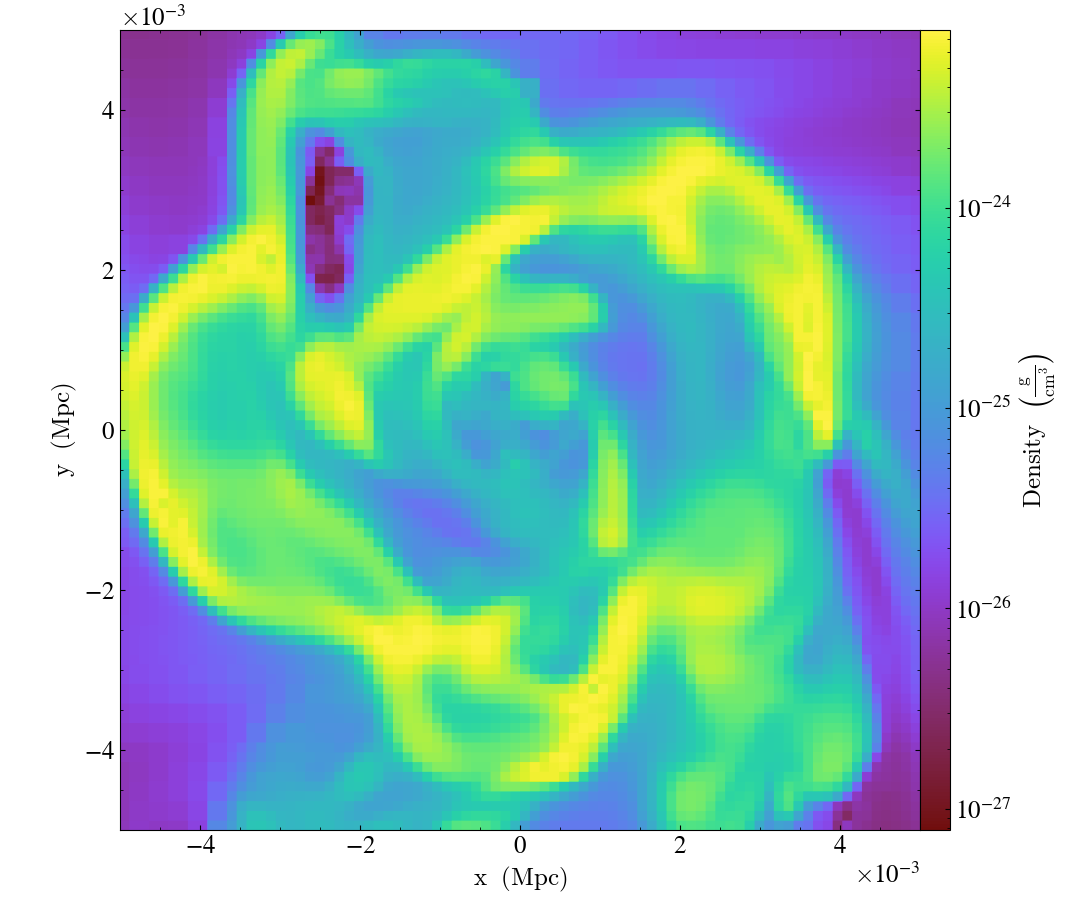
The same result could have been accomplished by explicitly setting the width
to (.01, 'Mpc').
Set image units
set_axes_unit() allows
the customization of the units used for the image and colorbar.
import yt
ds = yt.load("IsolatedGalaxy/galaxy0030/galaxy0030")
slc = yt.SlicePlot(ds, "z", ("gas", "density"), width=(10, "kpc"))
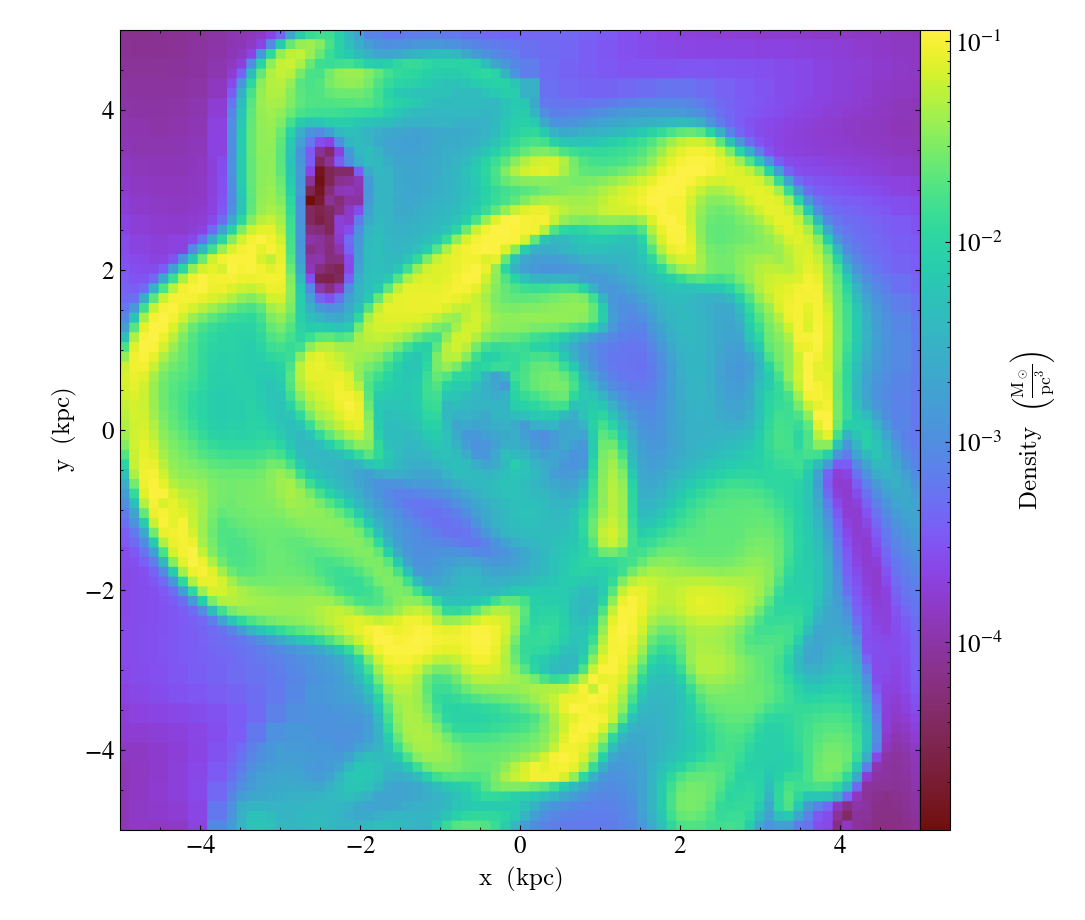
slc.set_unit(("gas", "density"), "Msun/pc**3")
slc.save()
If the unit you would like to convert to needs an equivalency, this can be
specified via the equivalency keyword argument of set_unit. For
example, let’s make a plot of the temperature field, but present it using
an energy unit instead of a temperature unit:
import yt
ds = yt.load("IsolatedGalaxy/galaxy0030/galaxy0030")
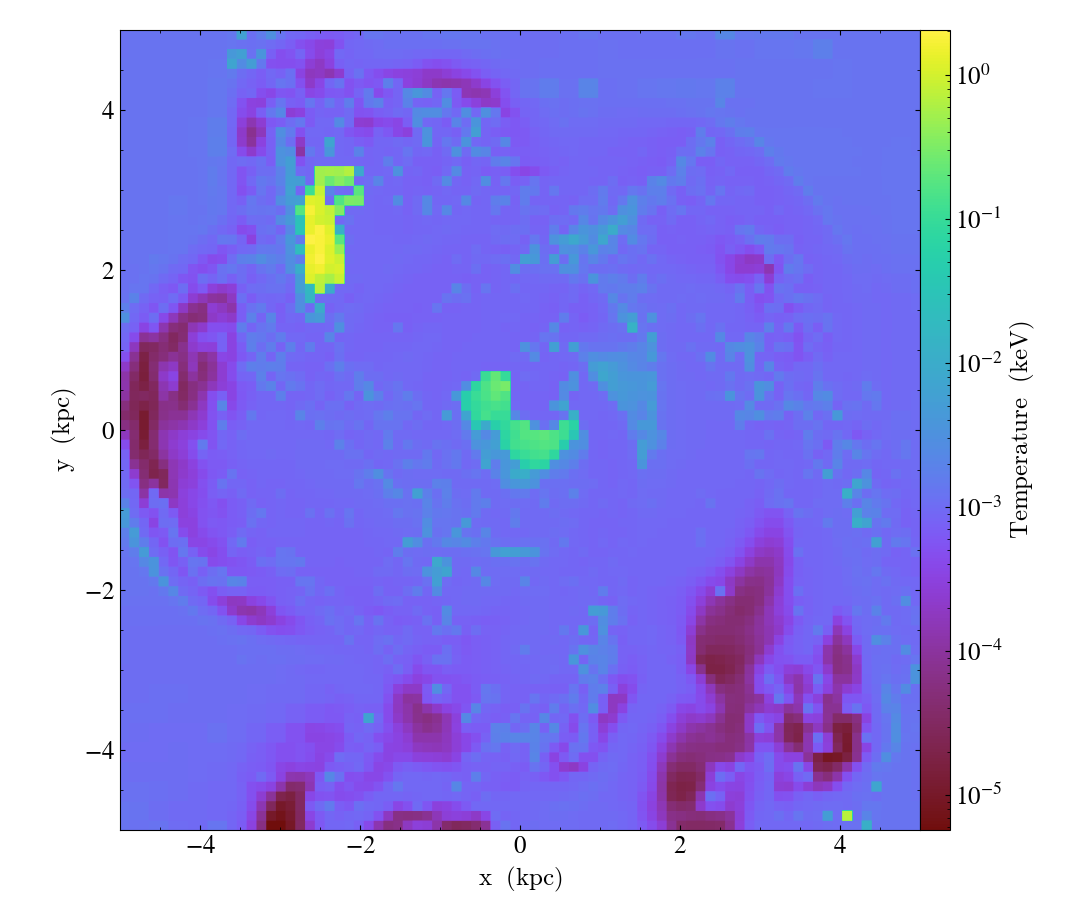
slc = yt.SlicePlot(ds, "z", ("gas", "temperature"), width=(10, "kpc"))
slc.set_unit(("gas", "temperature"), "keV", equivalency="thermal")
slc.save()
Set the plot center
The set_center()
function accepts a new center for the plot, in code units. New centers must be
two element tuples.
import yt

ds = yt.load("IsolatedGalaxy/galaxy0030/galaxy0030")
slc = yt.SlicePlot(ds, "z", ("gas", "density"), width=(10, "kpc"))
slc.set_center((0.5, 0.503))
slc.save()
Adjusting the plot view axes
There are a number of ways in which the initial orientation of a PlotWindow
object can be adjusted.
The first two axis orientation modifications,
flip_horizontal()
and flip_vertical(), are
equivalent to the invert_xaxis and invert_yaxis of matplotlib Axes
objects. flip_horizontal will invert the plot’s x-axis while the flip_vertical() method
will invert the plot’s y-axis
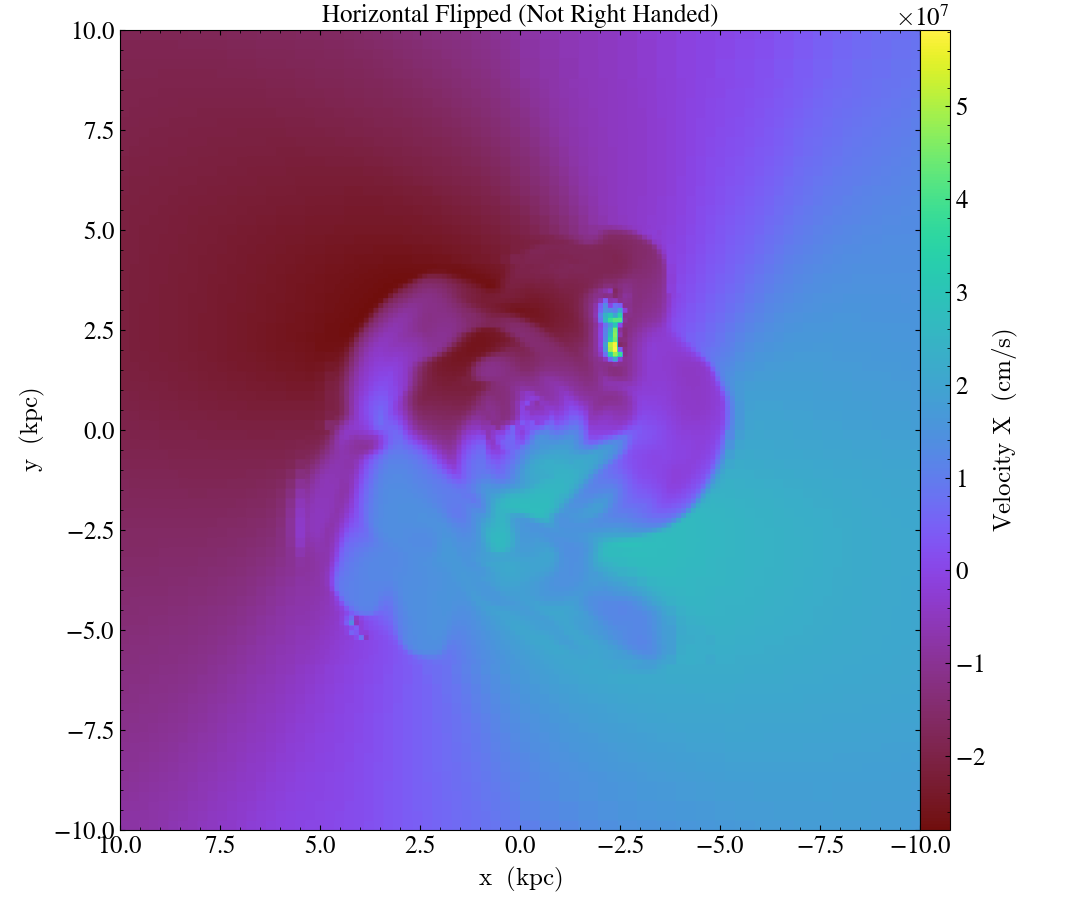
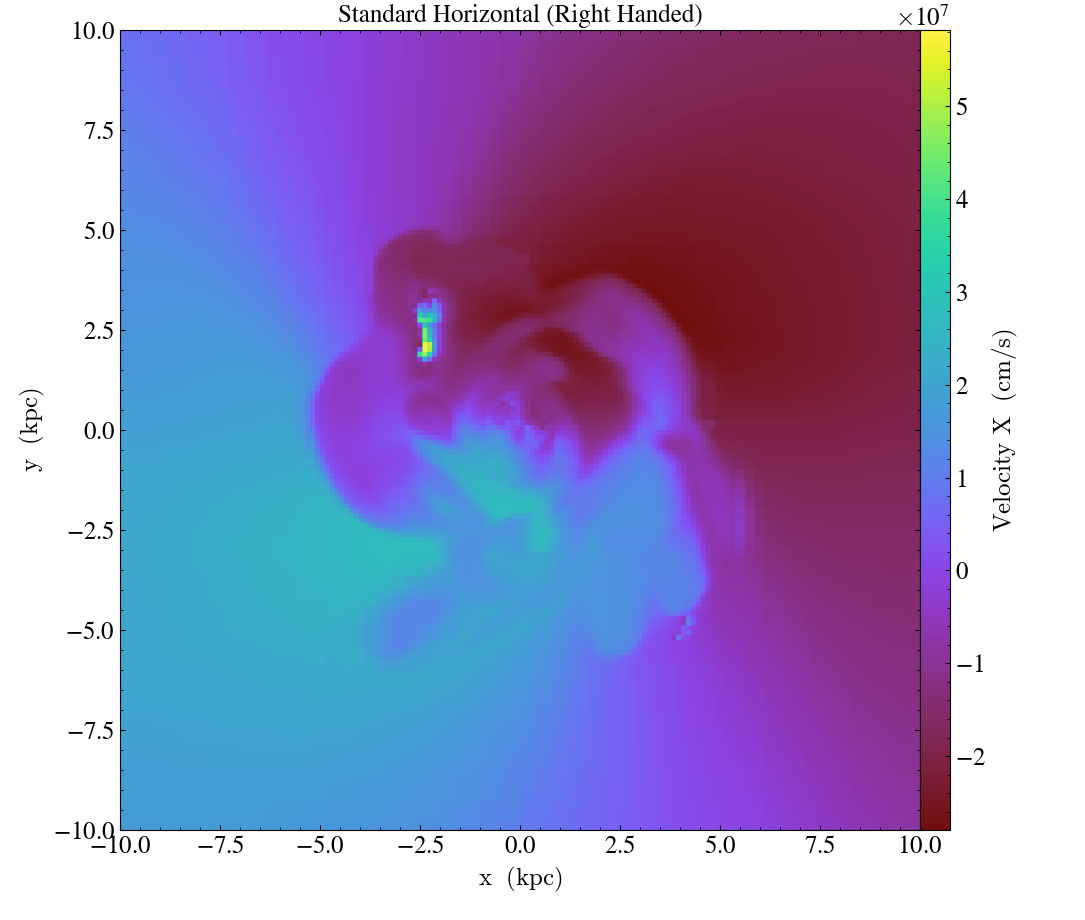
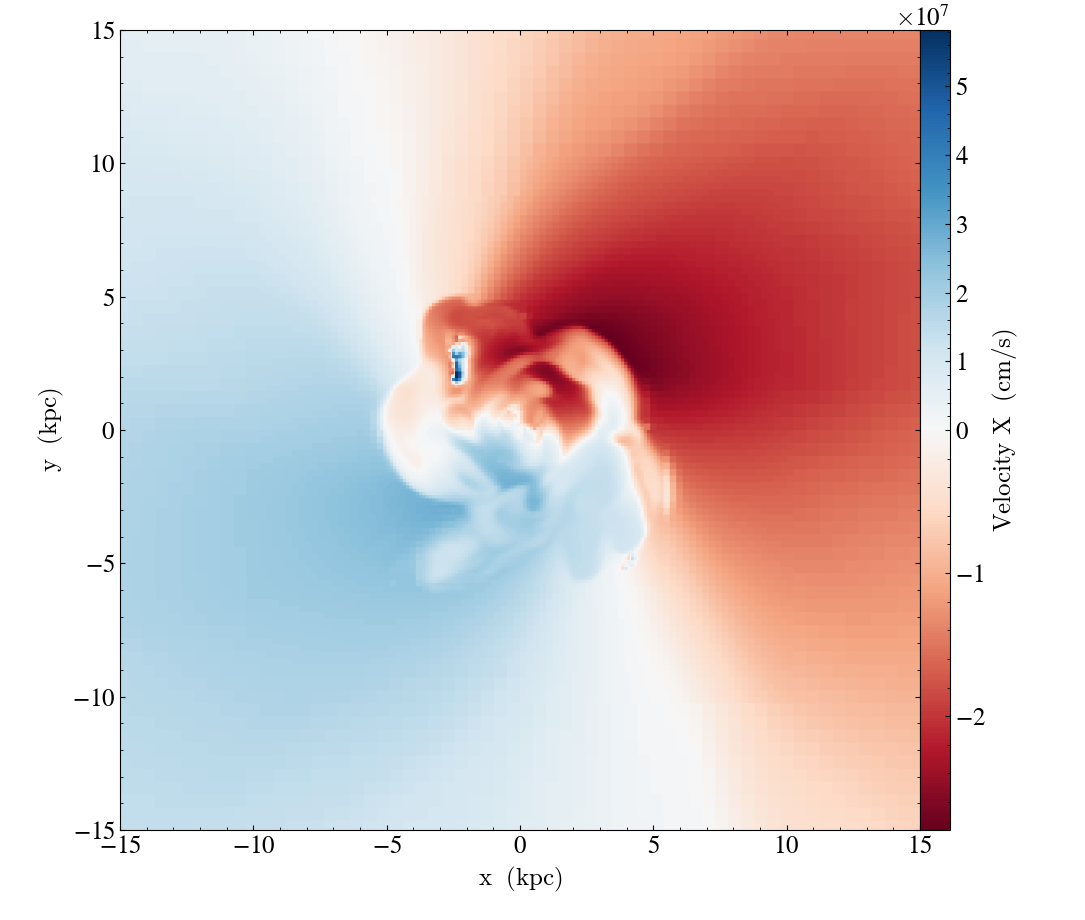
import yt
ds = yt.load("IsolatedGalaxy/galaxy0030/galaxy0030")
# slicing with standard view (right-handed)
slc = yt.SlicePlot(ds, "z", ("gas", "velocity_x"), width=(20, 'kpc'))
slc.annotate_title("Standard Horizontal (Right Handed)")
slc.save("Standard.png")
# flip the horizontal axis (not right handed)
slc.flip_horizontal()
slc.annotate_title("Horizontal Flipped (Not Right Handed)")
slc.save("NotRightHanded.png")
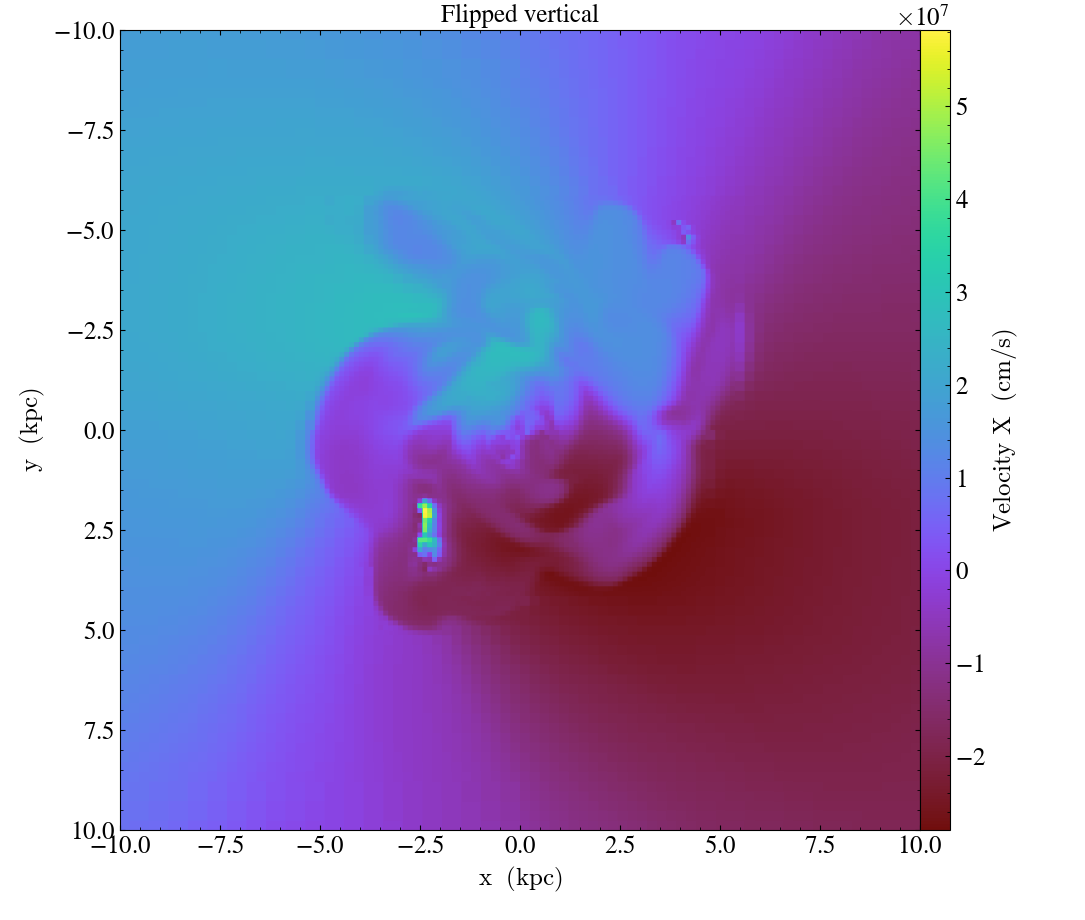
# flip the vertical axis
slc = yt.SlicePlot(ds, "z", ("gas", "velocity_x"), width=(20, 'kpc'))
slc.flip_vertical()
slc.annotate_title("Flipped vertical")
slc.save("FlippedVertical.png")
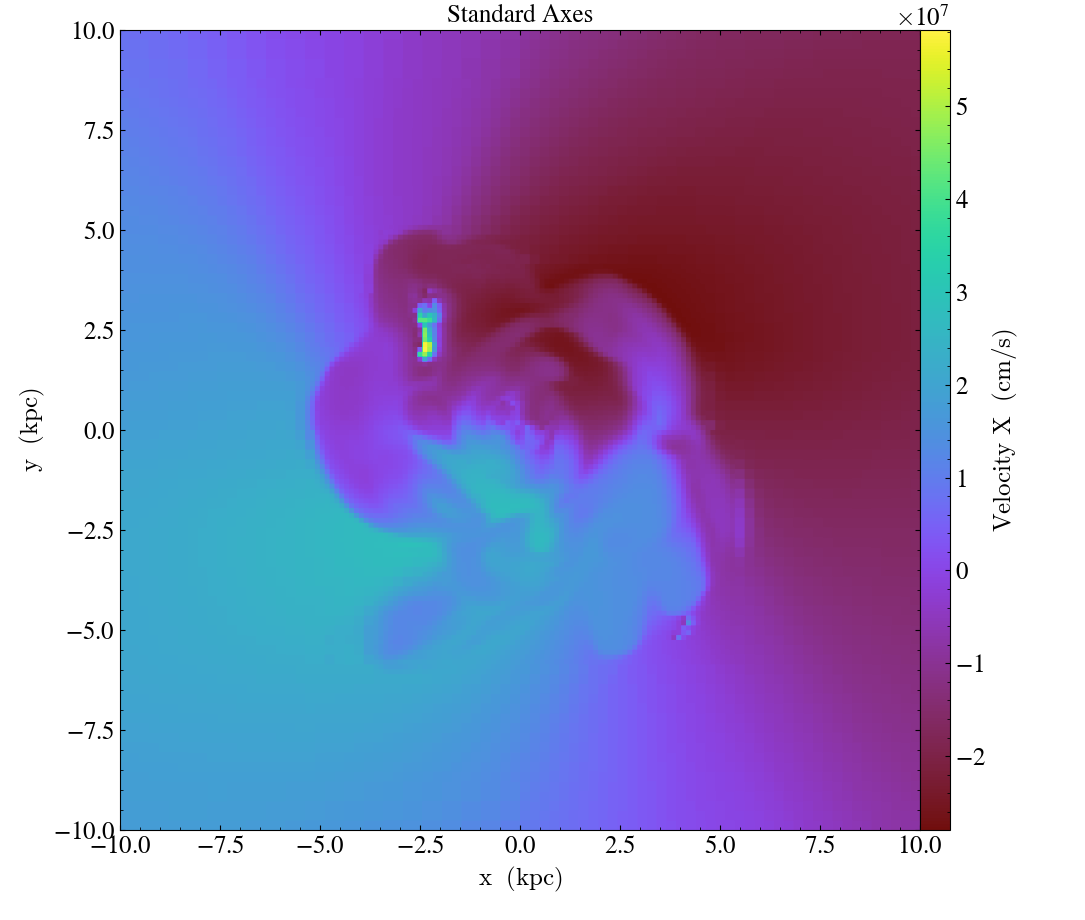
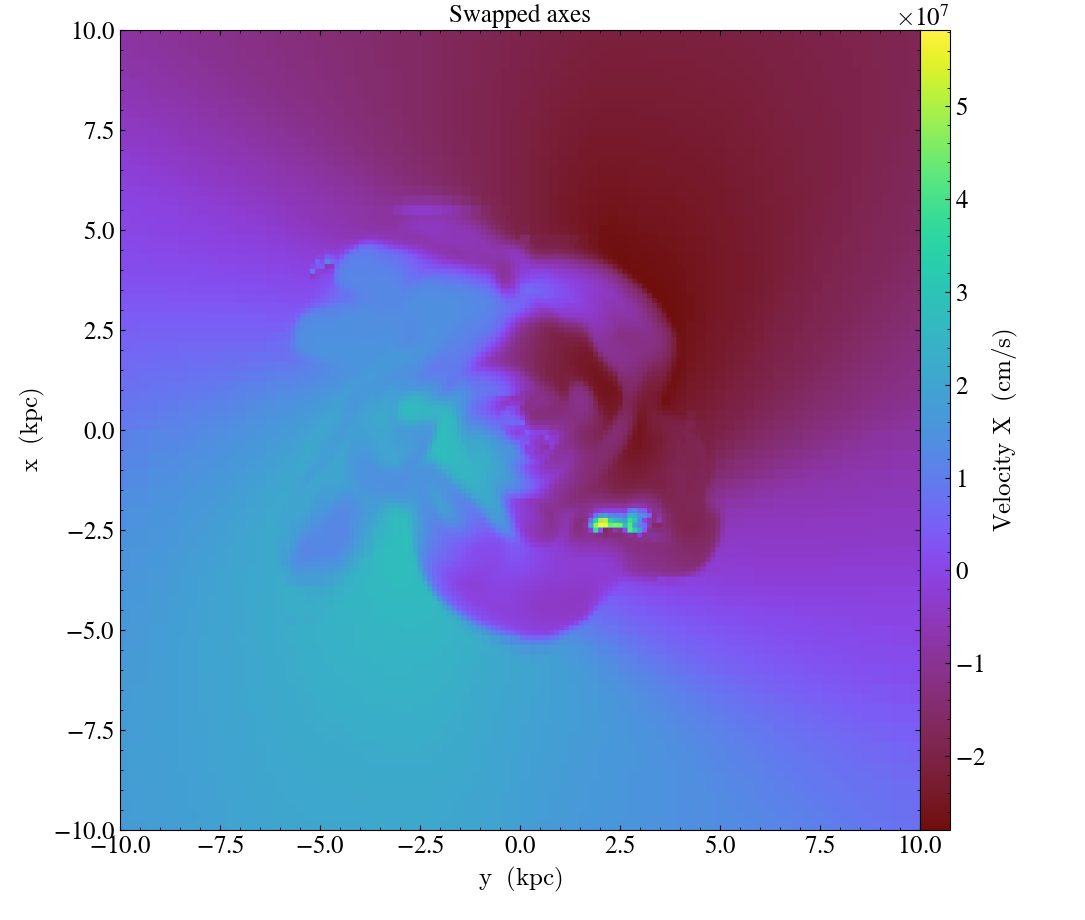
In addition to inverting the direction of each axis,
swap_axes() will exchange
the plot’s vertical and horizontal axes:
import yt

ds = yt.load("IsolatedGalaxy/galaxy0030/galaxy0030")
# slicing with non right-handed coordinates
slc = yt.SlicePlot(ds, "z", ("gas", "velocity_x"), width=(20, 'kpc'))
slc.swap_axes()
slc.annotate_title("Swapped axes")
slc.save("SwappedAxes.png")

# toggle swap_axes (return to standard view)
slc.swap_axes()
slc.annotate_title("Standard Axes")
slc.save("StandardAxes.png")
When using the flip_horizontal and flip_vertical with swap_axes, it
is important to remember that any flip_horizontal and flip_vertical
operations are applied to the image axes (not underlying dataset coordinates)
after any swap_axes calls, regardless of the order in which the callbacks
are added. Also note that when using swap_axes, any plot modifications
relating to limits, image width or resolution should still be supplied in reference
to the standard (unswapped) orientation rather than the swapped view.
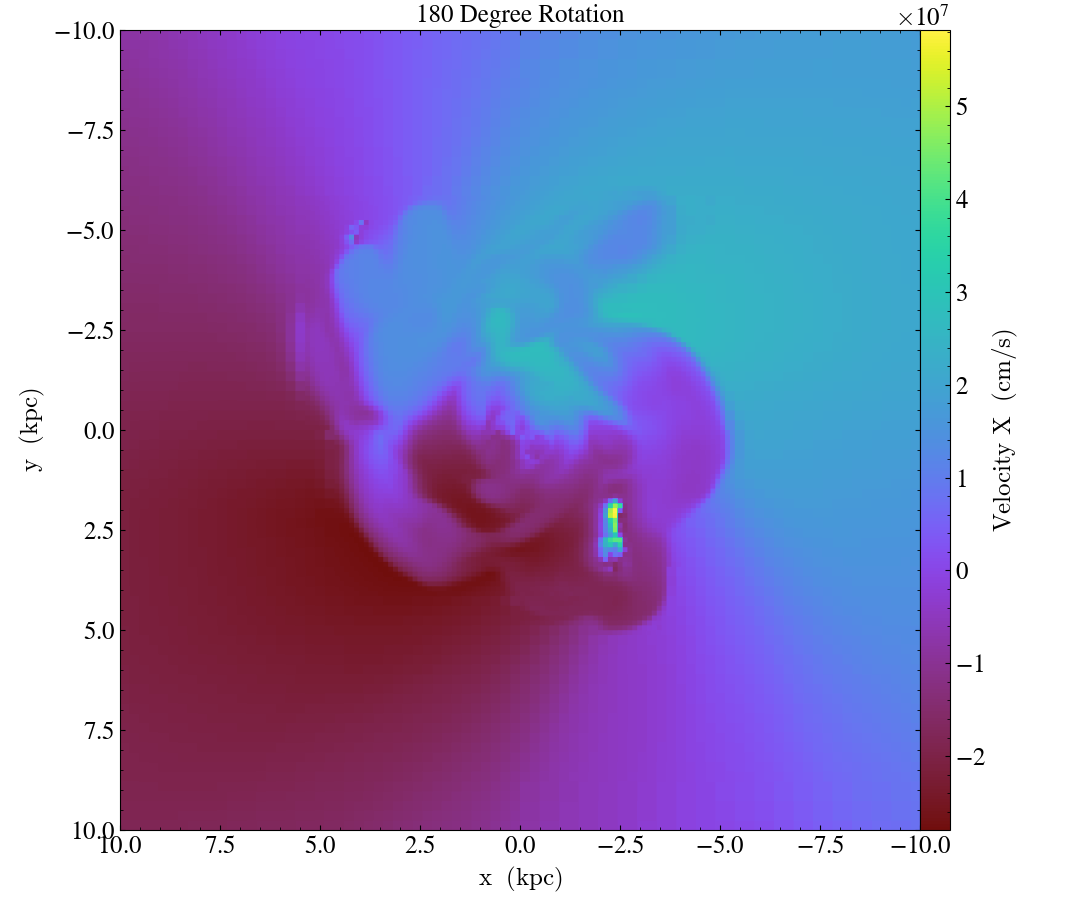
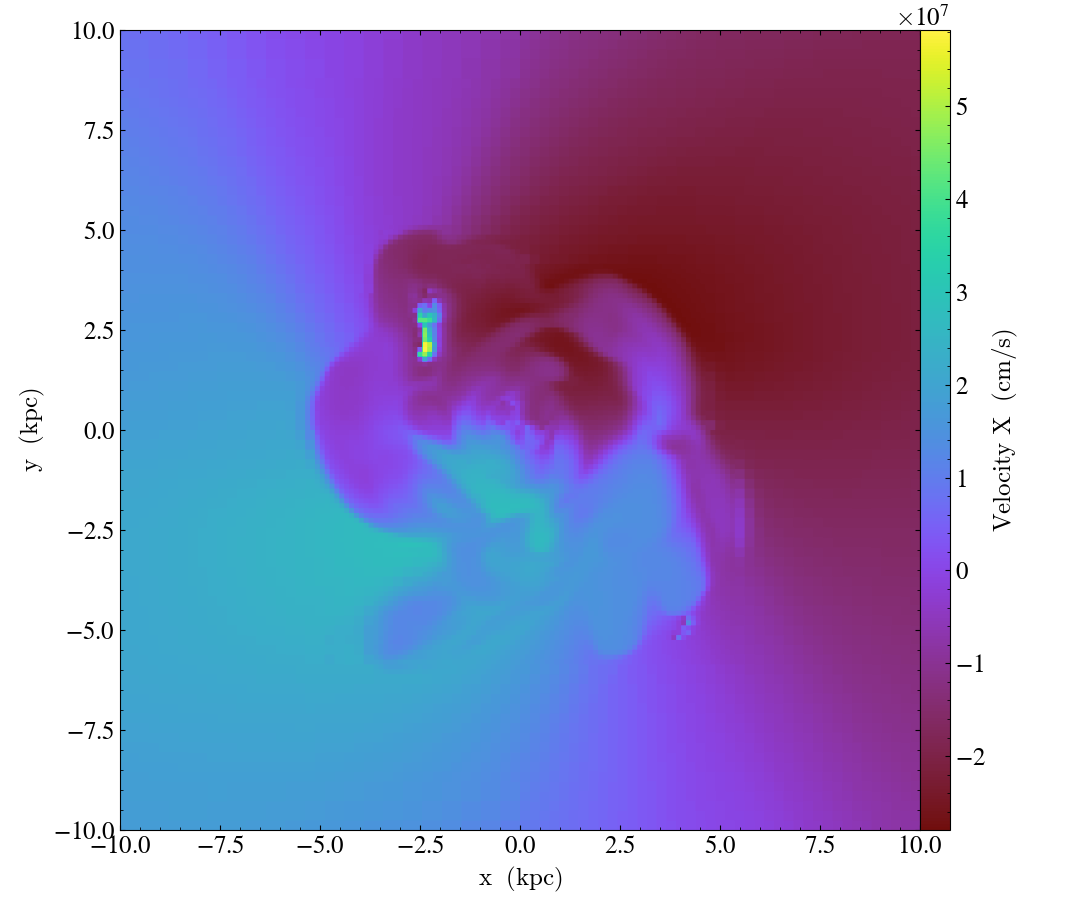
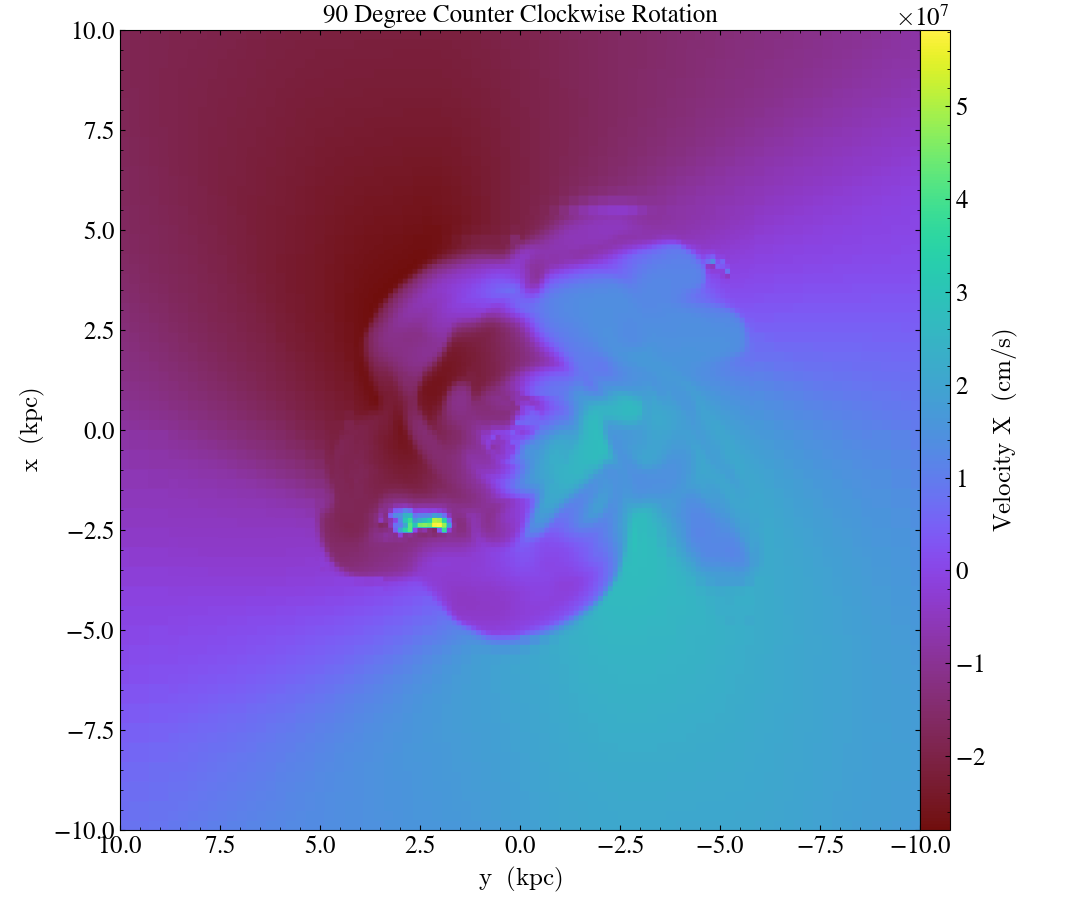
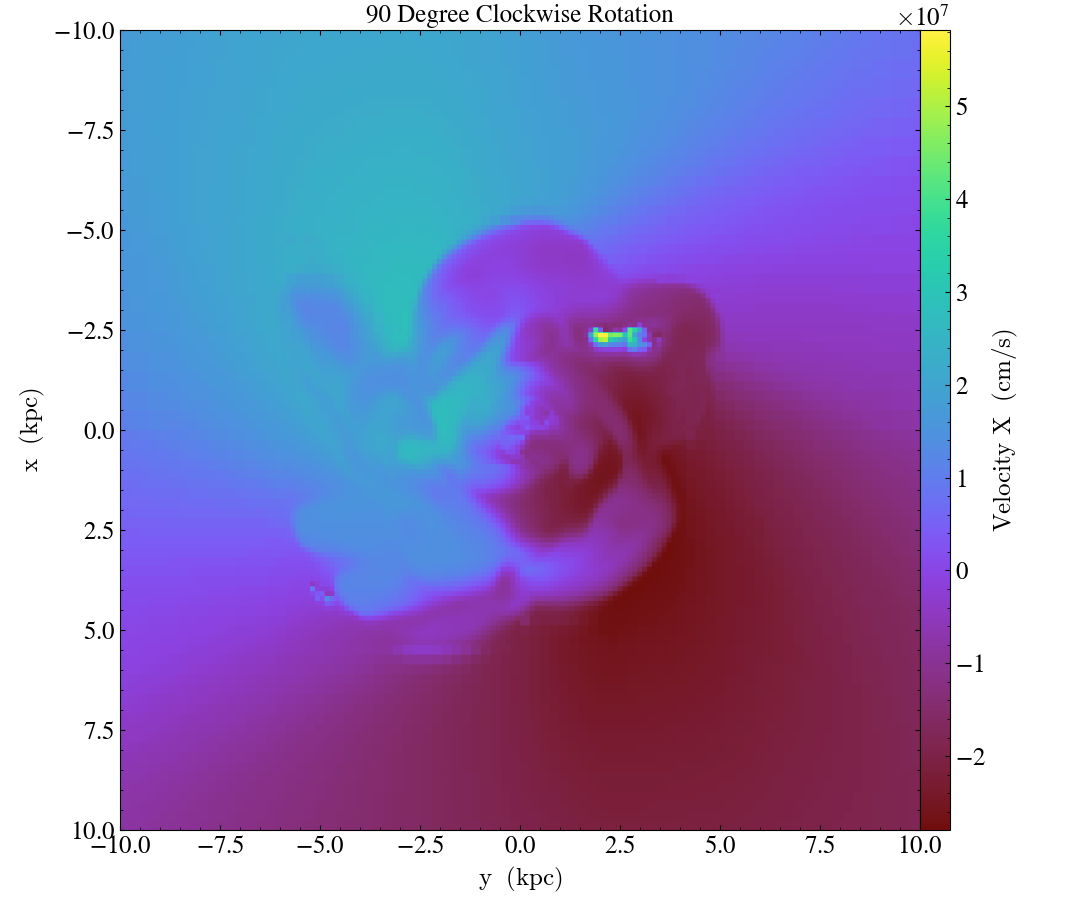
Finally, it’s worth mentioning that these three methods can be used in combination to rotate the view:
import yt

ds = yt.load("IsolatedGalaxy/galaxy0030/galaxy0030")
# initial view
slc = yt.SlicePlot(ds, "z", ("gas", "velocity_x"), width=(20, 'kpc'))
slc.save("InitialOrientation.png")
slc.annotate_title("Initial View")

# swap + vertical flip = rotate 90 degree rotation (clockwise)
slc.swap_axes()
slc.flip_vertical()
slc.annotate_title("90 Degree Clockwise Rotation")
slc.save("SwappedAxes90CW.png")

# vertical flip + horizontal flip = rotate 180 degree rotation
slc = yt.SlicePlot(ds, "z", ("gas", "velocity_x"), width=(20, 'kpc'))
slc.flip_horizontal()
slc.flip_vertical()
slc.annotate_title("180 Degree Rotation")
slc.save("FlipAxes180.png")

# swap + horizontal flip = rotate 90 degree rotation (counter clockwise)
slc = yt.SlicePlot(ds, "z", ("gas", "velocity_x"), width=(20, 'kpc'))
slc.swap_axes()
slc.flip_horizontal()
slc.annotate_title("90 Degree Counter Clockwise Rotation")
slc.save("SwappedAxes90CCW.png")
Hiding the Colorbar and Axis Labels
The PlotWindow class has functions
attached for hiding/showing the colorbar and axes. This allows for making
minimal plots that focus on the data:
import yt

ds = yt.load("IsolatedGalaxy/galaxy0030/galaxy0030")
slc = yt.SlicePlot(ds, "z", ("gas", "density"), width=(10, "kpc"))
slc.hide_colorbar()
slc.hide_axes()
slc.save()
See the cookbook recipe Showing and Hiding Axis Labels and Colorbars and the full function
description PlotWindow for more
information.
Fonts
set_font() allows font
customization.
import yt

ds = yt.load("IsolatedGalaxy/galaxy0030/galaxy0030")
slc = yt.SlicePlot(ds, "z", ("gas", "density"), width=(10, "kpc"))
slc.set_font({"family": "sans-serif", "style": "italic", "weight": "bold", "size": 24})
slc.save()
Colormaps
Each of these functions accepts at least two arguments. In all cases the first argument is a field name. This makes it possible to use different custom colormaps for different fields tracked by the plot object.
To change the colormap for the plot, call the
set_cmap() function.
Use any of the colormaps listed in the Colormaps section.
import yt

ds = yt.load("IsolatedGalaxy/galaxy0030/galaxy0030")
slc = yt.SlicePlot(ds, "z", ("gas", "density"), width=(10, "kpc"))
slc.set_cmap(("gas", "density"), "RdBu_r")
slc.save()
Colorbar Normalization / Scaling
For a general introduction to the topic of colorbar scaling, see https://matplotlib.org/stable/tutorials/colors/colormapnorms.html. Here we will focus on the defaults, and the ways to customize them, of yt plot classes. In this section, “norm” is used as short for “normalization”, and is interchangeable with “scaling”.
Map-like plots e.g., SlicePlot, ProjectionPlot and PhasePlot,
default to logarithmic (log)
normalization when all values are strictly positive, and symmetric log (symlog)
otherwise. yt supports two different interfaces to move away from the defaults.
See constrained norms and arbitrary norm hereafter.
Note
defaults can be configured on a per-field basis, see Available per-field Plot Options
Constrained norms
The standard way to change colorbar scalings between linear, log, and symmetric log (symlog). Colorbar properties can be constrained via two methods:
set_zlim()controls the limits of the colorbar range:zminandzmax.set_log()allows switching to linear or symlog normalization. With symlog, the linear threshold can be set explicitly. Otherwise, yt will dynamically determine a reasonable value.
Use the set_zlim()
method to set a custom colormap range.
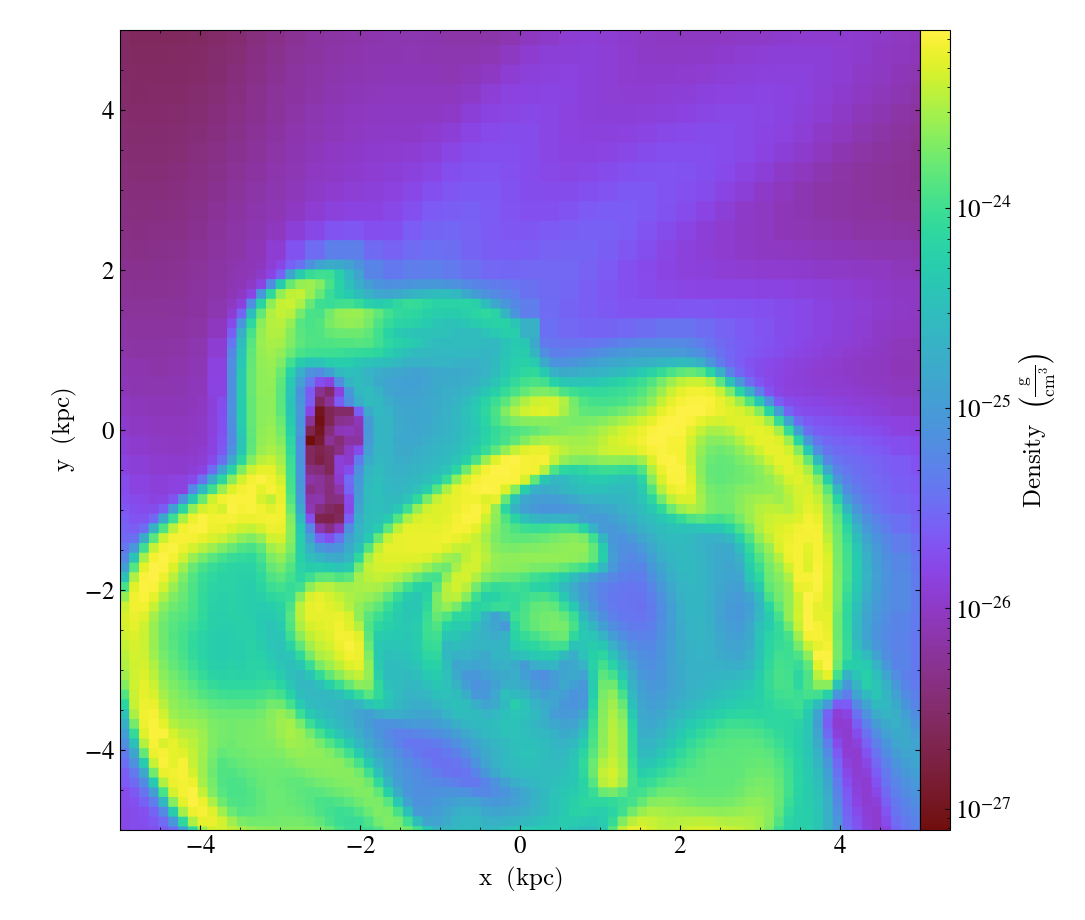
import yt

ds = yt.load("IsolatedGalaxy/galaxy0030/galaxy0030")
slc = yt.SlicePlot(ds, "z", ("gas", "density"), width=(10, "kpc"))
slc.set_zlim(("gas", "density"), zmin=(1e-30, "g/cm**3"), zmax=(1e-25, "g/cm**3"))
slc.save()
Units can be left out, in which case they implicitly match the current display
units of the colorbar (controlled with the set_unit method, see
Set image units).
It is not required to specify both zmin and zmax. Left unset, they will
default to the extreme values in the current view. This default behavior can be
enforced or restored by passing zmin="min" (reps. zmax="max")
explicitly.
set_log() takes a boolean argument
to select log (True) or linear (False) scalings.
import yt

ds = yt.load("IsolatedGalaxy/galaxy0030/galaxy0030")
slc = yt.SlicePlot(ds, "z", ("gas", "density"), width=(10, "kpc"))
slc.set_log(("gas", "density"), False) # switch to linear scaling
slc.save()
One can switch to symlog
by providing a “linear threshold” (linthresh) value.
With linthresh="auto" yt will switch to symlog norm and guess an appropriate value
automatically, with different behavior depending on the dynamic range of the data.
When the dynamic range of the symlog scale is less than 15 orders of magnitude, the
linthresh value will be the minimum absolute nonzero value, as in
import yt

ds = yt.load_sample("IsolatedGalaxy")
slc = yt.SlicePlot(ds, "z", ("gas", "density"), width=(10, "kpc"))
slc.set_log(("gas", "density"), linthresh="auto")
slc.save()
When the dynamic range of the symlog scale exceeds 15 orders of magnitude, the linthresh value is calculated as 1/1015 of the maximum nonzero value in order to avoid possible floating point precision issues. The following plot triggers the dynamic range cutoff
import yt

ds = yt.load_sample("FIRE_M12i_ref11")
p = yt.ProjectionPlot(ds, "x", ("gas", "density"), width=(30, "Mpc"))
p.set_log(("gas", "density"), linthresh="auto")
p.save()
In the previous example, it is actually safe to expand the dynamic range and in other cases you may find that the selected linear threshold is not well suited to your dataset. To pass an explicit value instead
import yt

ds = yt.load_sample("FIRE_M12i_ref11")
p = yt.ProjectionPlot(ds, "x", ("gas", "density"), width=(30, "Mpc"))
p.set_log(("gas", "density"), linthresh=(1e-22, "g/cm**2"))
p.save()
Similar to the zmin and zmax arguments of the set_zlim method, units
can be left out in linthresh.
Arbitrary norms
Alternatively, arbitrary matplotlib norms can be
passed via the set_norm()
method. In that case, any numeric value is treated as having implicit units,
matching the current display units. This alternative interface is more flexible,
but considered experimental as of yt 4.1. Don’t forget that with great power
comes great responsibility.
import yt
from matplotlib.colors import TwoSlopeNorm

ds = yt.load("IsolatedGalaxy/galaxy0030/galaxy0030")
slc = yt.SlicePlot(ds, "z", ("gas", "velocity_x"), width=(30, "kpc"))
slc.set_norm(("gas", "velocity_x"), TwoSlopeNorm(vcenter=0))

# using a diverging colormap to emphasize that vcenter corresponds to the
# middle value in the color range
slc.set_cmap(("gas", "velocity_x"), "RdBu")
slc.save()
Note
When calling
set_norm(), any constraints
previously set with
set_log() or
set_zlim() will be dropped.
Conversely, calling set_log or set_zlim will have the
effect of dropping any norm previously set via set_norm.
The set_background_color()
function accepts a field name and a color (optional). If color is given, the function
will set the plot’s background color to that. If not, it will set it to the bottom
value of the color map.
import yt

ds = yt.load("IsolatedGalaxy/galaxy0030/galaxy0030")
slc = yt.SlicePlot(ds, "z", ("gas", "density"), width=(1.5, "Mpc"))
slc.set_background_color(("gas", "density"))
slc.save("bottom_colormap_background")
slc.set_background_color(("gas", "density"), color="black")
slc.save("black_background")
Annotations
A slice object can also add annotations like a title, an overlying quiver plot, the location of grid boundaries, halo-finder annotations, and many other annotations, including user-customizable annotations. For example:
import yt

ds = yt.load("IsolatedGalaxy/galaxy0030/galaxy0030")
slc = yt.SlicePlot(ds, "z", ("gas", "density"), width=(10, "kpc"))
slc.annotate_grids()
slc.save()
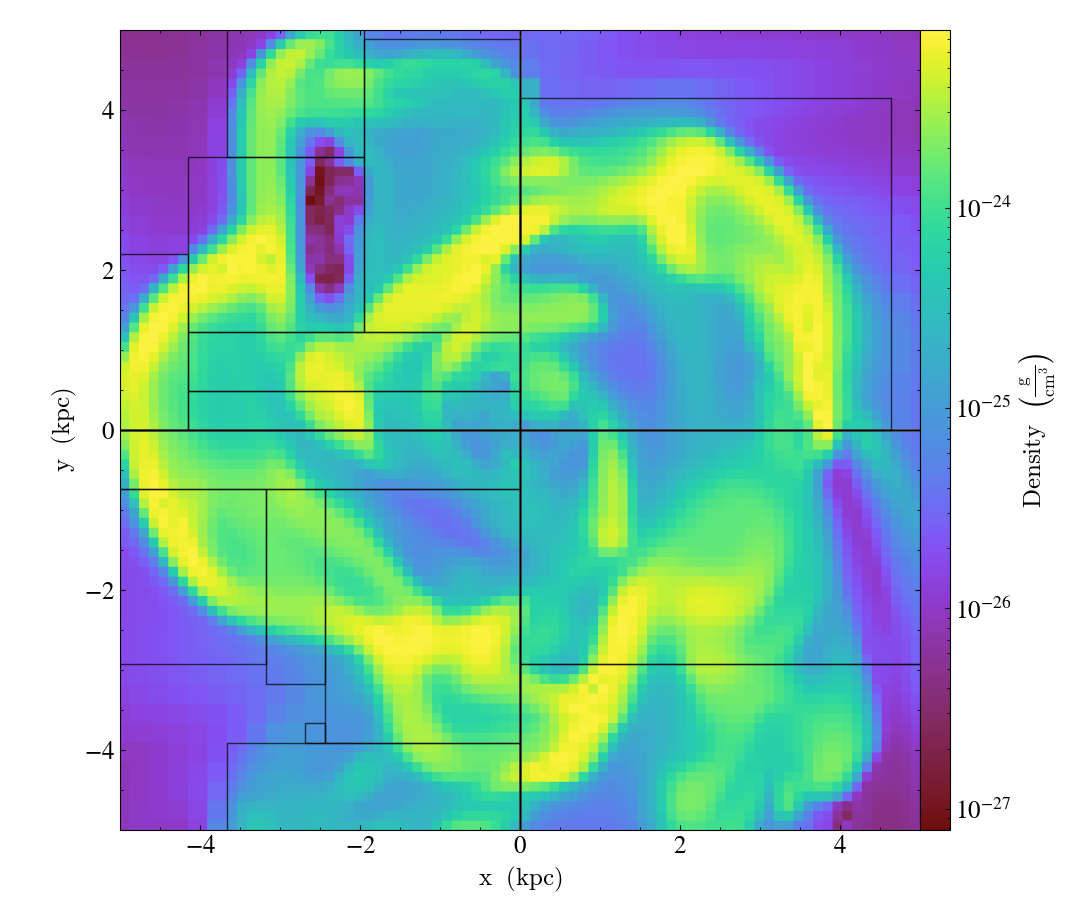
will plot the density field in a 10 kiloparsec slice through the z-axis centered on the highest density point in the simulation domain. Before saving the plot, the script annotates it with the grid boundaries, which are drawn as lines in the plot, with colors going from black to white depending on the AMR level of the grid.
Annotations are described in Plot Modifications: Overplotting Contours, Velocities, Particles, and More.
Set the size and resolution of the plot
To set the size of the plot, use the
set_figure_size() function. The argument
is the size of the longest edge of the plot in inches. View the full resolution
image to see the difference more clearly.
import yt

ds = yt.load("IsolatedGalaxy/galaxy0030/galaxy0030")
slc = yt.SlicePlot(ds, "z", ("gas", "density"), width=(10, "kpc"))
slc.set_figure_size(10)
slc.save()
To change the resolution of the image, call the
set_buff_size() function.
import yt

ds = yt.load("IsolatedGalaxy/galaxy0030/galaxy0030")
slc = yt.SlicePlot(ds, "z", ("gas", "density"), width=(10, "kpc"))
slc.set_buff_size(1600)
slc.save()
Also see cookbook recipe Varying the resolution of an image for more information about the parameters that determine the resolution of your images.
Turning off minorticks
By default minorticks for the x and y axes are turned on.
The minorticks may be removed using the
set_minorticks()
function, which either accepts a specific field name including the ‘all’ alias
and the desired state for the plot as ‘on’ or ‘off’. There is also an analogous
set_colorbar_minorticks()
function for the colorbar axis.
import yt

ds = yt.load("IsolatedGalaxy/galaxy0030/galaxy0030")
slc = yt.SlicePlot(ds, "z", ("gas", "density"), width=(10, "kpc"))
slc.set_minorticks("all", False)
slc.set_colorbar_minorticks("all", False)
slc.save()
Further customization via matplotlib
Each PlotWindow object is really a
container for plots - one plot for each field specified in the list of fields
supplied when the plot object is created. The individual plots can be
accessed via the plots dictionary attached to each
PlotWindow object:
slc = SlicePlot(ds, 2, [("gas", "density"), ("gas", "temperature")])
dens_plot = slc.plots["gas", "density"]
In this example dens_plot is an instance of
WindowPlotMPL, an object that wraps the
matplotlib
figure
and axes
objects. We can access these matplotlib primitives via attributes of
dens_plot.
figure = dens_plot.figure
axes = dens_plot.axes
colorbar_axes = dens_plot.cax
These are the figure and axes objects that control the actual drawing of the plot. Arbitrary plot customizations are possible by manipulating these objects. See Accessing and Modifying Plots Directly for an example.
1D Profile Plots
1D profiles are used to calculate the average or the sum of a given quantity with respect to a second quantity. Two common examples are the “average density as a function of radius” or “the total mass within a given set of density bins.” When created, they default to the average: in fact, they default to the average as weighted by the total cell mass. However, this can be modified to take either the total value or the average with respect to a different quantity.
Profiles operate on data objects; they will take the
entire data contained in a sphere, a prism, an extracted region and so on, and
they will calculate and use that as input to their calculation. To make a 1D
profile plot, create a (ProfilePlot)
object, supplying the data object, the field for binning, and a list of fields
to be profiled.
import yt
from yt.units import kpc

ds = yt.load("IsolatedGalaxy/galaxy0030/galaxy0030")
my_galaxy = ds.disk(ds.domain_center, [0.0, 0.0, 1.0], 10 * kpc, 3 * kpc)
plot = yt.ProfilePlot(my_galaxy, ("gas", "density"), [("gas", "temperature")])
plot.save()
This will create a YTDisk
centered at [0.5, 0.5, 0.5], with a normal vector of [0.0, 0.0, 1.0], radius of
10 kiloparsecs and height of 3 kiloparsecs and will then make a plot of the
mass-weighted average temperature as a function of density for all of the gas
contained in the cylinder.
We could also have made a profile considering only the gas in a sphere. For instance:
import yt

ds = yt.load("IsolatedGalaxy/galaxy0030/galaxy0030")
my_sphere = ds.sphere([0.5, 0.5, 0.5], (100, "kpc"))
plot = yt.ProfilePlot(my_sphere, ("gas", "temperature"), [("gas", "mass")], weight_field=None)
plot.save()
Note that because we have specified the weighting field to be None, the
profile plot will display the accumulated cell mass as a function of temperature
rather than the average. Also note the use of a (value, unit) tuple. These
can be used interchangeably with units explicitly imported from yt.units when
creating yt plots.
We can also accumulate along the bin field of a ProfilePlot (the bin field
is the x-axis in a ProfilePlot, in the last example the bin field is
Temperature) by setting the accumulation keyword argument to True.
The following example uses weight_field = None and accumulation = True to
generate a plot of the enclosed mass in a sphere:
import yt

ds = yt.load("IsolatedGalaxy/galaxy0030/galaxy0030")
my_sphere = ds.sphere([0.5, 0.5, 0.5], (100, "kpc"))
plot = yt.ProfilePlot(
    my_sphere, "radius", [("gas", "mass")], weight_field=None, accumulation=True
)
plot.save()
Notably, above we have specified the field tuple for the mass, but not for the
radius field. The radius field will not be ambiguous, but if you want
to ensure that it refers to the radius of the cells on which the “gas” field
type is defined, you can specify it using the field tuple ("index",
"radius").
You can also access the data generated by profiles directly, which can be
useful for overplotting average quantities on top of phase plots, or for
exporting and plotting multiple profiles simultaneously from a time series.
The profiles attribute contains a list of all profiles that have been
made. For each item in the list, the x field data can be accessed with x.
The profiled fields can be accessed from the dictionary field_data.
plot = ProfilePlot(
    my_sphere, ("gas", "temperature"), [("gas", "mass")], weight_field=None
)
profile = plot.profiles[0]
# print the bin field, in this case temperature
print(profile.x)
# print the profiled mass field
print(profile["gas", "mass"])
Other options, such as the number of bins, are also configurable. See the
documentation for ProfilePlot for
more information.
Overplotting Multiple 1D Profiles
It is often desirable to overplot multiple 1D profile to show evolution
with time. This is supported with the from_profiles class method.
1D profiles are created with the create_profile()
method and then given to the ProfilePlot object.
import yt

# Create a time-series object.
es = yt.load_simulation("enzo_tiny_cosmology/32Mpc_32.enzo", "Enzo")
es.get_time_series(redshifts=[5, 4, 3, 2, 1, 0])

# Lists to hold profiles, labels, and plot specifications.
profiles = []
labels = []

# Loop over each dataset in the time-series.
for ds in es:
    # Create a data container to hold the whole dataset.
    ad = ds.all_data()
    # Create a 1d profile of density vs. temperature.
    profiles.append(
        yt.create_profile(
            ad,
            [("gas", "temperature")],
            fields=[("gas", "mass")],
            weight_field=None,
            accumulation=True,
        )
    )

    # Add labels
    labels.append("z = %.2f" % ds.current_redshift)

# Create the profile plot from the list of profiles.
plot = yt.ProfilePlot.from_profiles(profiles, labels=labels)

# Save the image.
plot.save()
Customizing axis limits
By default the x and y limits for ProfilePlot are determined using the
Extrema derived quantity. If you
want to create a plot with custom axis limits, you have two options.
First, you can create a custom profile object using
create_profile().
This function accepts a dictionary of (max, min) tuples keyed to field names.
import yt
import yt.units as u

ds = yt.load("IsolatedGalaxy/galaxy0030/galaxy0030")
sp = ds.sphere("m", 10 * u.kpc)
profiles = yt.create_profile(
    sp,
    ("gas", "temperature"),
    ("gas", "density"),
    weight_field=None,
    extrema={("gas", "temperature"): (1e3, 1e7), ("gas", "density"): (1e-26, 1e-22)},
)
plot = yt.ProfilePlot.from_profiles(profiles)
plot.save()
You can also make use of the
set_xlim() and
set_ylim() functions to
customize the axes limits of a plot that has already been created. Note that
calling set_xlim is much slower than calling set_ylim. This is because
set_xlim must recreate the profile object using the specified extrema.
Creating a profile directly via create_profile()
might be significantly faster.
Note that since there is only one bin field, set_xlim
does not accept a field name as the first argument.
import yt
import yt.units as u

ds = yt.load("IsolatedGalaxy/galaxy0030/galaxy0030")
sp = ds.sphere("m", 10 * u.kpc)
plot = yt.ProfilePlot(sp, ("gas", "temperature"), ("gas", "density"), weight_field=None)
plot.set_xlim(1e3, 1e7)
plot.set_ylim(("gas", "density"), 1e-26, 1e-22)
plot.save()
Customizing Units
Units for both the x and y axis can be controlled via the
set_unit() method.
Adjusting the plot units does not require recreating the histogram, so adjusting
units will always be inexpensive, requiring only an in-place unit conversion.
In the following example we create a plot of the average density in solar masses per cubic parsec as a function of radius in kiloparsecs.
import yt
import yt.units as u

ds = yt.load("IsolatedGalaxy/galaxy0030/galaxy0030")
sp = ds.sphere("m", 10 * u.kpc)
plot = yt.ProfilePlot(sp, "radius", ("gas", "density"), weight_field=None)
plot.set_unit(("gas", "density"), "msun/pc**3")
plot.set_unit("radius", "kpc")
plot.save()
Linear and Logarithmic Scaling
The axis scaling can be manipulated via the
set_log() function. This
function accepts a field name and a boolean. If the boolean is True, the
field is plotted in log scale. If False, the field is plotted in linear
scale.
In the following example we create a plot of the average x velocity as a function of radius. Since the x component of the velocity vector can be negative, we set the scaling to be linear for this field.
import yt
import yt.units as u

ds = yt.load("IsolatedGalaxy/galaxy0030/galaxy0030")
sp = ds.sphere("m", 10 * u.kpc)
plot = yt.ProfilePlot(sp, "radius", ("gas", "velocity_x"), weight_field=None)
plot.set_log(("gas", "velocity_x"), False)
plot.save()
Setting axis labels
The axis labels can be manipulated via the
set_ylabel() and
set_xlabel() functions. The
set_ylabel() function accepts a field name
and a string with the desired label. The set_xlabel()
function just accepts the desired label and applies this to all of the plots.
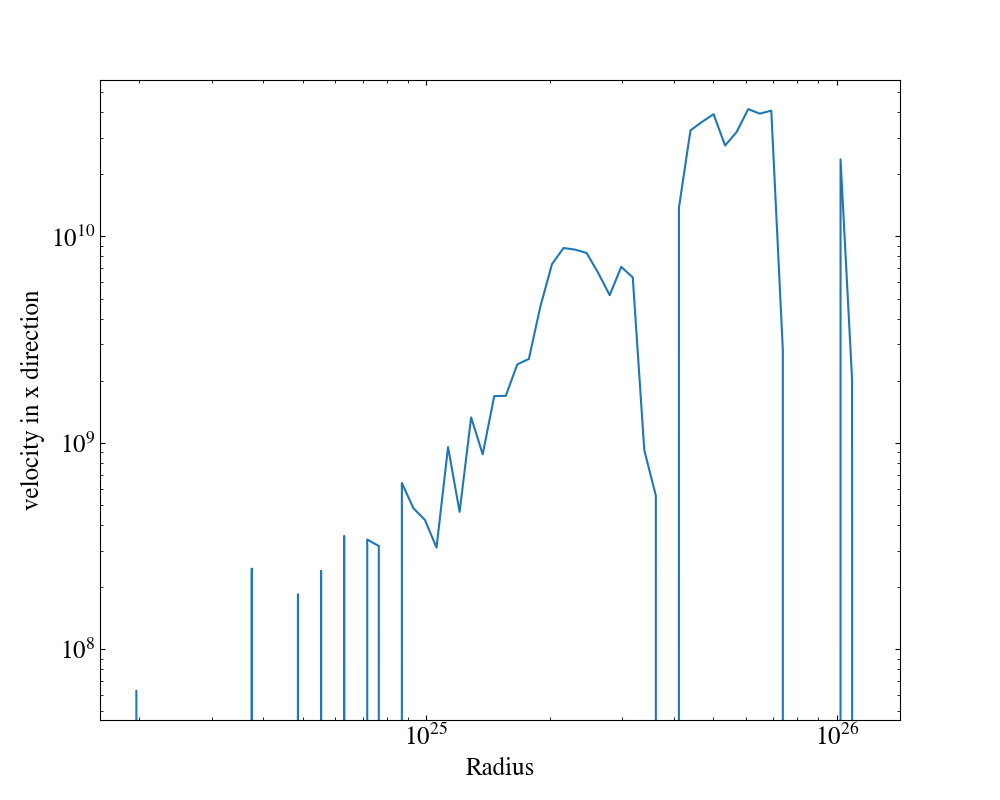
In the following example we create a plot of the average x-velocity and density as a function of radius. The xlabel is set to “Radius”, for all plots, and the ylabel is set to “velocity in x direction” for the x-velocity plot.
import yt

ds = yt.load("enzo_tiny_cosmology/DD0046/DD0046")
ad = ds.all_data()
plot = yt.ProfilePlot(ad, "radius", [("gas", "temperature"), ("gas", "velocity_x")], weight_field=None)
plot.set_xlabel("Radius")
plot.set_ylabel(("gas", "velocity_x"), "velocity in x direction")
plot.save()
Adding plot title
Plot title can be set via the
annotate_title() function.
It accepts a string argument which is the plot title and an optional field parameter which specifies
the field for which plot title should be added. field could be a string or a list of string.
If field is not passed, plot title will be added for the fields.
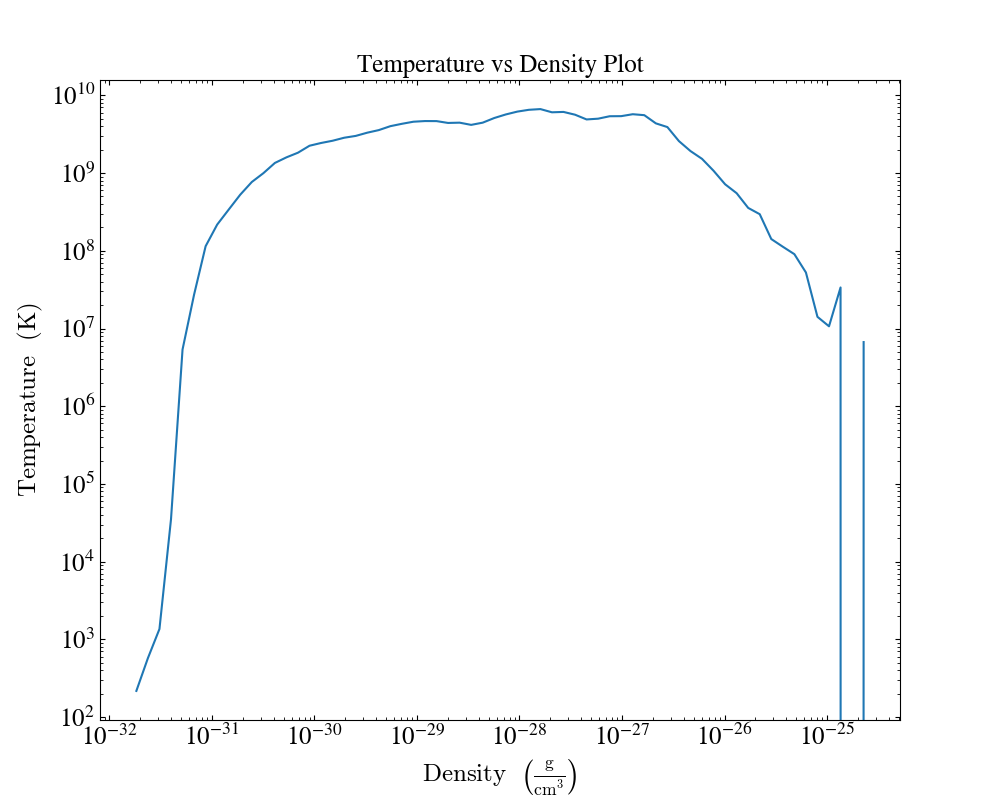
In the following example we create a plot and set the plot title.
import yt

ds = yt.load("enzo_tiny_cosmology/DD0046/DD0046")
ad = ds.all_data()
plot = yt.ProfilePlot(ad, ("gas", "density"), [("gas", "temperature")], weight_field=None)
plot.annotate_title("Temperature vs Density Plot")
plot.save()
Another example where we create plots from profile. By specifying the fields we can add plot title to a specific plot.
import yt

ds = yt.load("enzo_tiny_cosmology/DD0046/DD0046")
sphere = ds.sphere("max", (1.0, "Mpc"))
profiles = []
profiles.append(yt.create_profile(sphere, ["radius"], fields=[("gas", "density")], n_bins=64))
profiles.append(
    yt.create_profile(sphere, ["radius"], fields=["dark_matter_density"], n_bins=64)
)
plot = yt.ProfilePlot.from_profiles(profiles)
plot.annotate_title("Plot Title: Density", ("gas", "density"))
plot.annotate_title("Plot Title: Dark Matter Density", "dark_matter_density")
plot.save()
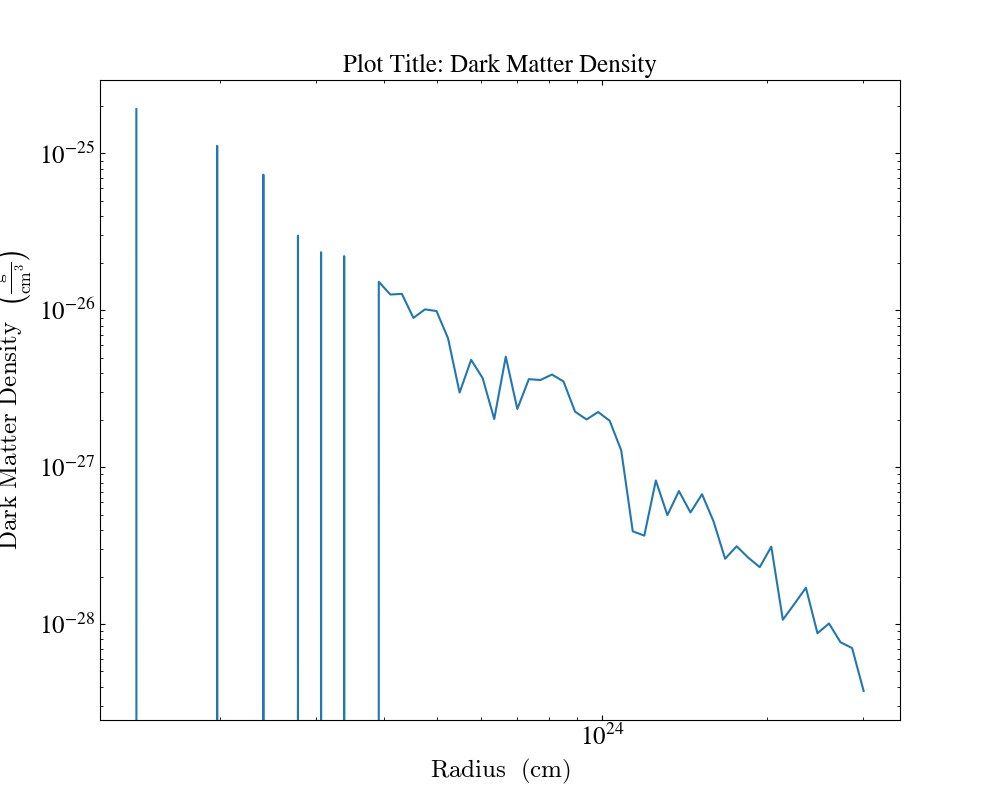
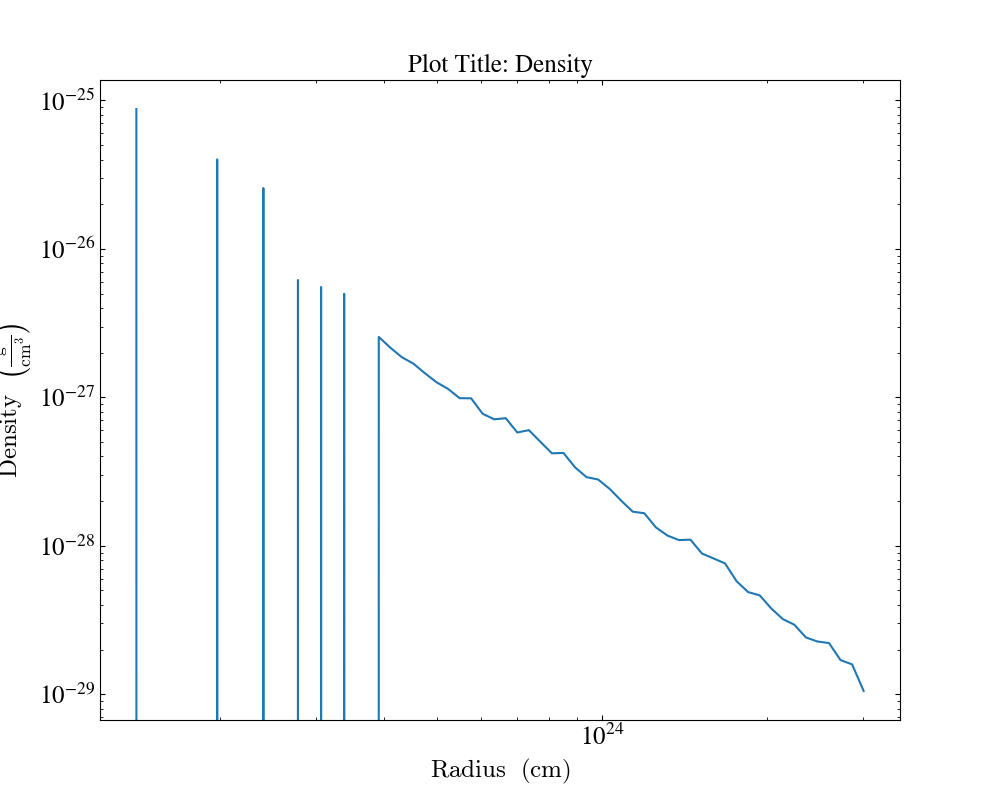
Here, plot.annotate_title("Plot Title: Density", ("gas", "density")) will only set the plot title for the "density"
field. Thus, allowing us the option to have different plot titles for different fields.
Annotating plot with text
Plots can be annotated at a desired (x,y) coordinate using annotate_text() function.
This function accepts the x-position, y-position, a text string to
be annotated in the plot area, and an optional list of fields for annotating plots with the specified field.
Furthermore, any keyword argument accepted by the matplotlib axes.text function could also be passed which will can be useful to change fontsize, text-alignment, text-color or other such properties of annotated text.
In the following example we create a plot and add a simple annotation.
import yt

ds = yt.load("enzo_tiny_cosmology/DD0046/DD0046")
ad = ds.all_data()
plot = yt.ProfilePlot(ad, ("gas", "density"), [("gas", "temperature")], weight_field=None)
plot.annotate_text(1e-30, 1e7, "Annotated Text")
plot.save()
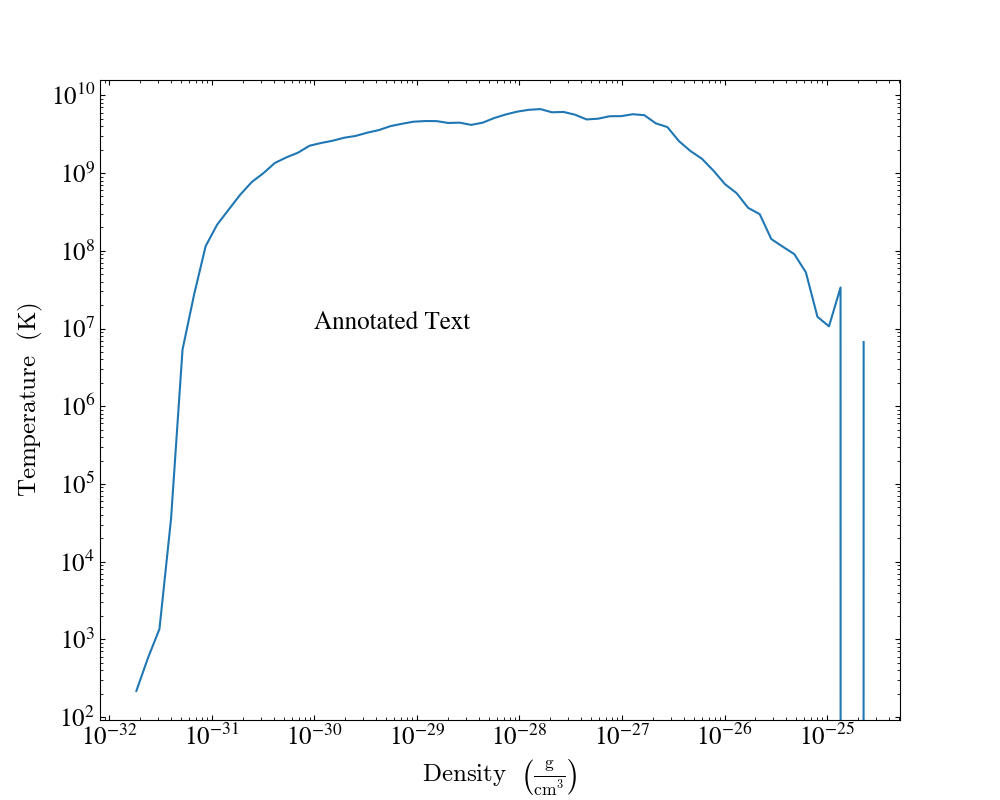
To add annotations to a particular set of fields we need to pass in the list of fields as follows,
where "ftype1" and "ftype2" are the field types (and may be the same):
plot.annotate_text(
    1e-30, 1e7, "Annotation", [("ftype1", "field1"), ("ftype2", "field2")]
)
To change the text annotated text properties, we need to pass the matplotlib axes.text arguments as follows:
plot.annotate_text(
    1e-30,
    1e7,
    "Annotation",
    fontsize=20,
    bbox=dict(facecolor="red", alpha=0.5),
    horizontalalignment="center",
    verticalalignment="center",
)
The above example will set the fontsize of annotation to 20, add a bounding box of red color and center align horizontally and vertically. The is just an example to modify the text properties, for further options please check matplotlib.axes.Axes.text.
Altering Line Properties
Line properties for any and all of the profiles can be changed with the
set_line_property() function.
The two arguments given are the line property and desired value.
plot.set_line_property("linestyle", "--")
With no additional arguments, all of the lines plotted will be altered. To change the property of a single line, give also the index of the profile.
# change only the first line
plot.set_line_property("linestyle", "--", 0)
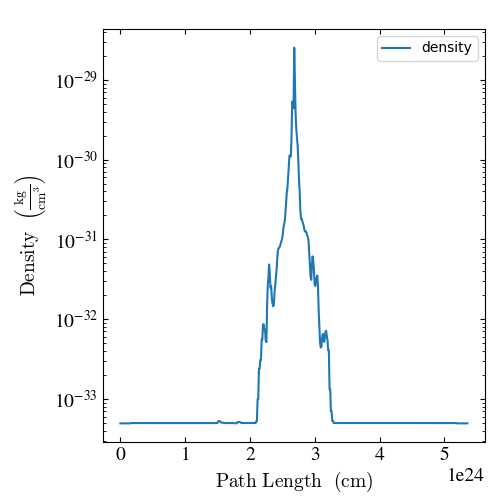
1D Line Sampling
YT has the ability to sample datasets along arbitrary lines
and plot the result. You must supply five arguments to the LinePlot
class. They are enumerated below:
Dataset
A list of fields or a single field you wish to plot
The starting point of the sampling line. This should be an n-element list, tuple, ndarray, or YTArray with the elements corresponding to the coordinates of the starting point. (n should equal the dimension of the dataset)
The ending point of the sampling line. This should also be an n-element list, tuple, ndarray, or YTArray with the elements corresponding to the coordinates of the ending point.
The number of sampling points along the line, e.g. if 1000 is specified, then data will be sampled at 1000 points evenly spaced between the starting and ending points.
The below code snippet illustrates how this is done:
ds = yt.load("SecondOrderTris/RZ_p_no_parts_do_nothing_bcs_cone_out.e", step=-1)
plot = yt.LinePlot(ds, [("all", "v"), ("all", "u")], (0, 0, 0), (0, 1, 0), 1000)
plot.save()
If working in a Jupyter Notebook, LinePlot also has the show() method.
You can add a legend to a 1D sampling plot. The legend process takes two steps:
When instantiating the
LinePlot, pass a dictionary of labels with keys corresponding to the field namesCall the
LinePlotannotate_legendmethod
X- and Y- axis units can be set with set_x_unit and set_unit methods
respectively. The below code snippet combines all the features we’ve discussed:
import yt

ds = yt.load("IsolatedGalaxy/galaxy0030/galaxy0030")

plot = yt.LinePlot(ds, ("gas", "density"), [0, 0, 0], [1, 1, 1], 512)
plot.annotate_legend(("gas", "density"))
plot.set_x_unit("cm")
plot.set_unit(("gas", "density"), "kg/cm**3")
plot.save()
If a list of fields is passed to LinePlot, yt will create a number of
individual figures equal to the number of different dimensional
quantities. E.g. if LinePlot receives two fields with units of “length/time”
and a field with units of “temperature”, two different figures will be created,
one with plots of the “length/time” fields and another with the plot of the
“temperature” field. It is only necessary to call annotate_legend
for one field of a multi-field plot to produce a legend containing all the
labels passed in the initial construction of the LinePlot instance. Example:
import yt

ds = yt.load("SecondOrderTris/RZ_p_no_parts_do_nothing_bcs_cone_out.e", step=-1)
plot = yt.LinePlot(
    ds,
    [("all", "v"), ("all", "u")],
    [0, 0, 0],
    [0, 1, 0],
    100,
    field_labels={("all", "u"): r"v$_x$", ("all", "v"): r"v$_y$"},
)
plot.annotate_legend(("all", "u"))
plot.save()

LinePlot is a bit different from yt ray objects which are data
containers. LinePlot is a plotting class that may use yt ray objects to
supply field plotting information. However, perhaps the most important
difference to highlight between rays and LinePlot is that rays return data
elements that intersect with the ray and make no guarantee about the spacing
between data elements. LinePlot sampling points are guaranteed to be evenly
spaced. In the case of cell data where multiple points fall within the same
cell, the LinePlot object will show the same field value for each sampling
point that falls within the same cell.
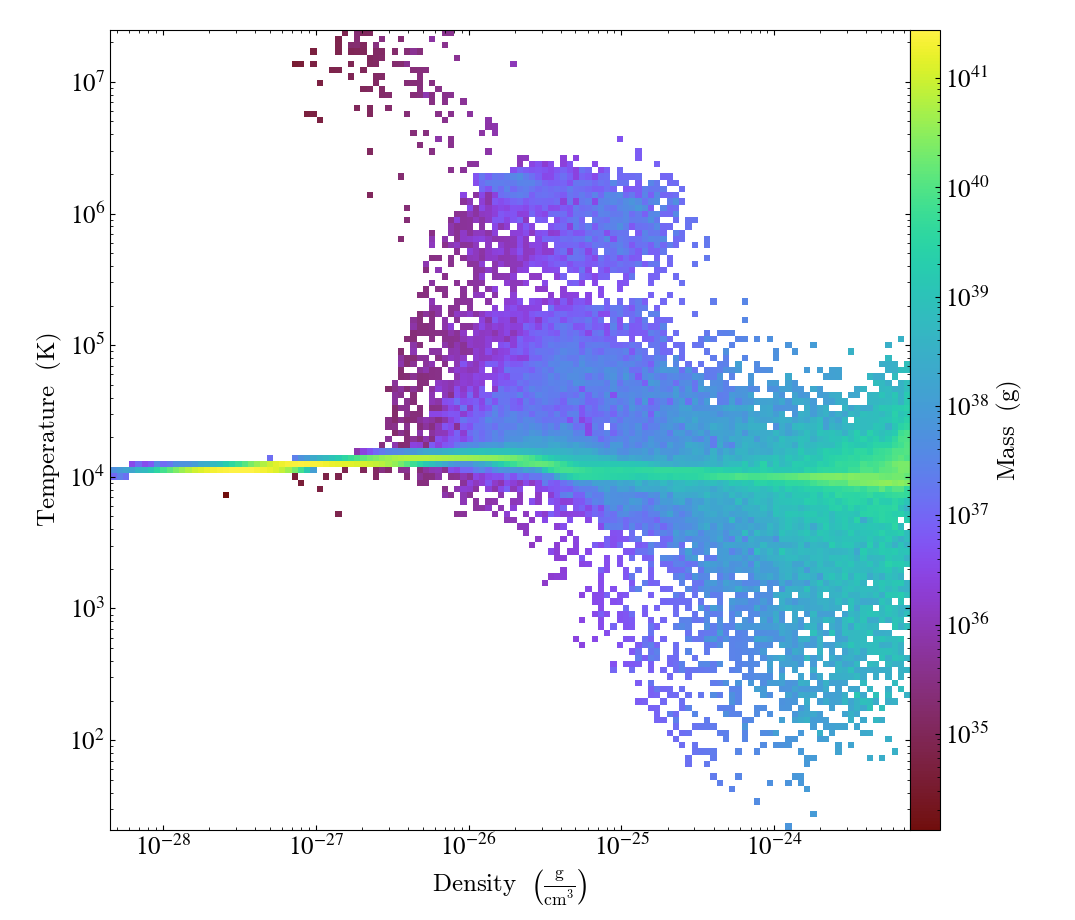
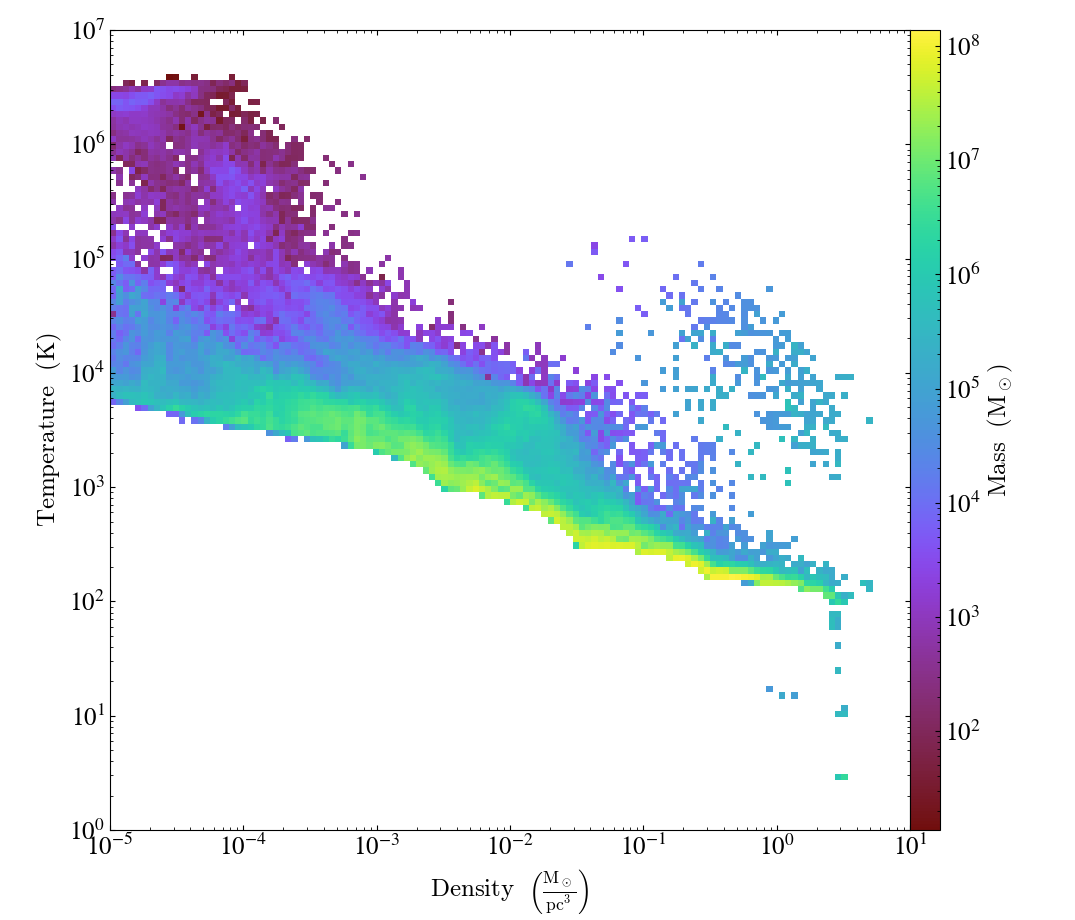
2D Phase Plots
2D phase plots function in much the same was as 1D phase plots, but with a
PhasePlot object. Much like 1D
profiles, 2D profiles (phase plots) are best thought of as plotting a
distribution of points, either taking the average or the accumulation in a bin.
The default behavior is to average, using the cell mass as the weighting,
but this behavior can be controlled through the weight_field parameter.
For example, to generate a 2D distribution of mass enclosed in density and
temperature bins, you can do:
import yt

ds = yt.load("IsolatedGalaxy/galaxy0030/galaxy0030")
my_sphere = ds.sphere("c", (50, "kpc"))
plot = yt.PhasePlot(
    my_sphere, ("gas", "density"), ("gas", "temperature"), [("gas", "mass")], weight_field=None
)
plot.save()
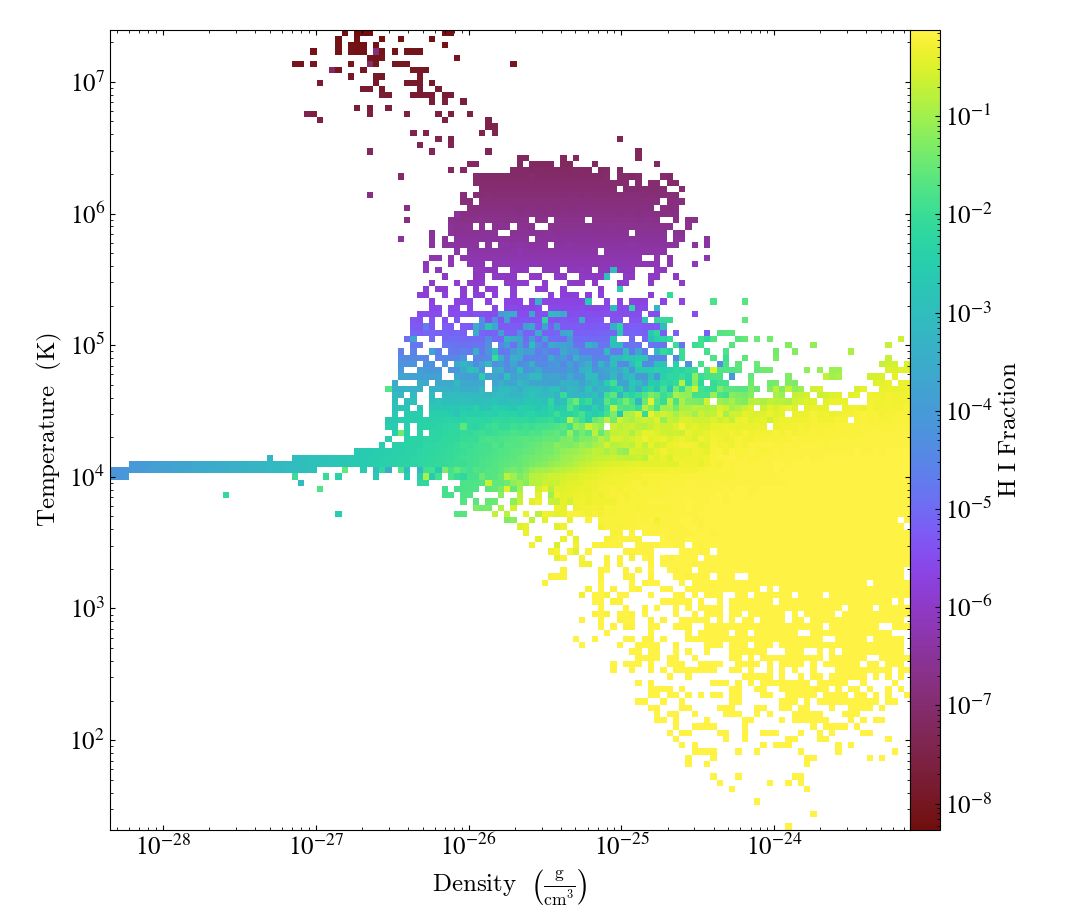
If you would rather see the average value of a field as a function of two other
fields, leave off the weight_field argument, and it will average by
the cell mass. This would look
something like:
import yt

ds = yt.load("IsolatedGalaxy/galaxy0030/galaxy0030")
my_sphere = ds.sphere("c", (50, "kpc"))
plot = yt.PhasePlot(my_sphere, ("gas", "density"), ("gas", "temperature"), [("gas", "H_p0_fraction")])
plot.save()
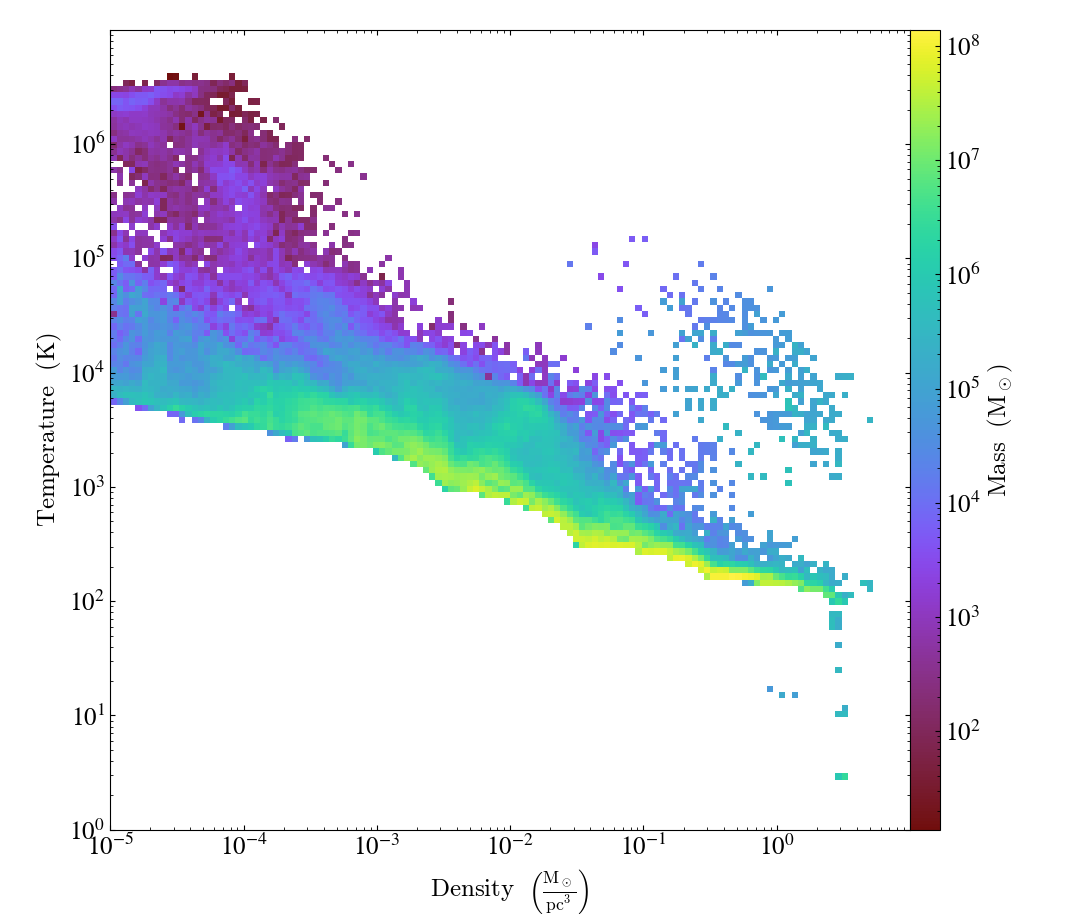
Customizing Phase Plots
Similarly to 1D profile plots, PhasePlot
can be customized via set_unit,
set_xlim, set_ylim, and set_zlim. The following example illustrates
how to manipulate these functions. PhasePlot
can also be customized in a similar manner as
SlicePlot, such as with hide_colorbar
and show_colorbar.
import yt
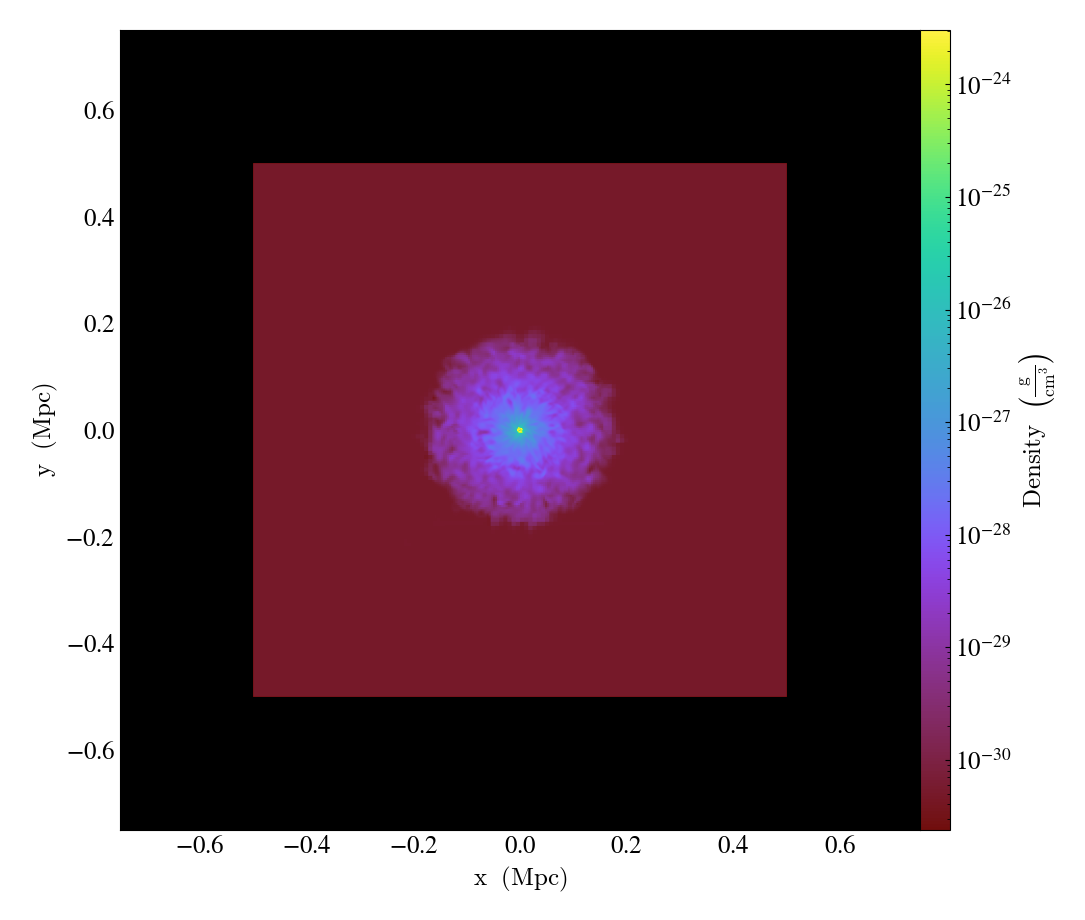
ds = yt.load("sizmbhloz-clref04SNth-rs9_a0.9011/sizmbhloz-clref04SNth-rs9_a0.9011.art")
center = ds.arr([64.0, 64.0, 64.0], "code_length")
rvir = ds.quan(1e-1, "Mpccm/h")
sph = ds.sphere(center, rvir)
plot = yt.PhasePlot(sph, ("gas", "density"), ("gas", "temperature"), ("gas", "mass"), weight_field=None)
plot.set_unit(("gas", "density"), "Msun/pc**3")
plot.set_unit(("gas", "mass"), "Msun")
plot.set_xlim(1e-5, 1e1)
plot.set_ylim(1, 1e7)
plot.save()
It is also possible to construct a custom 2D profile object and then use the
from_profile() function to
create a PhasePlot using the profile object.
This will sometimes be faster, especially if you need custom x and y axes
limits. The following example illustrates this workflow:
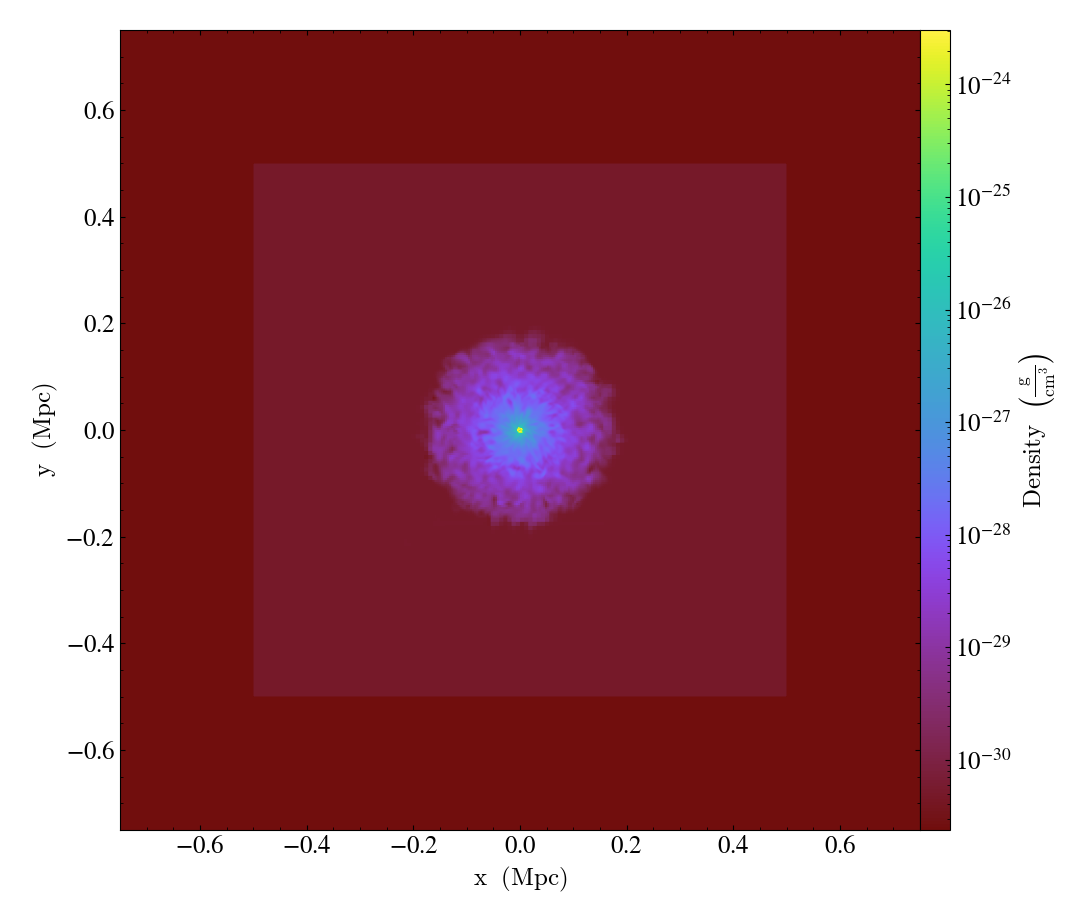
import yt

ds = yt.load("sizmbhloz-clref04SNth-rs9_a0.9011/sizmbhloz-clref04SNth-rs9_a0.9011.art")
center = ds.arr([64.0, 64.0, 64.0], "code_length")
rvir = ds.quan(1e-1, "Mpccm/h")
sph = ds.sphere(center, rvir)
units = {("gas", "density"): "Msun/pc**3", ("gas", "mass"): "Msun"}
extrema = {("gas", "density"): (1e-5, 1e1), ("gas", "temperature"): (1, 1e7)}

profile = yt.create_profile(
    sph,
    [("gas", "density"), ("gas", "temperature")],
    n_bins=[128, 128],
    fields=[("gas", "mass")],
    weight_field=None,
    units=units,
    extrema=extrema,
)

plot = yt.PhasePlot.from_profile(profile)

plot.save()
Probability Distribution Functions and Accumulation
Both 1D and 2D profiles which show the total of amount of some field, such as
mass, in a bin (done by setting the weight_field keyword to None) can be
turned into probability distribution functions (PDFs) by setting the
fractional keyword to True. When set to True, the value in each bin
is divided by the sum total from all bins. These can be turned into cumulative
distribution functions (CDFs) by setting the accumulation keyword to
True. This will make it so that the value in any bin N is the cumulative
sum of all bins from 0 to N. The direction of the summation can be reversed by
setting accumulation to -True. For PhasePlot, the accumulation can
be set independently for each axis by setting accumulation to a list of
True/ -True /False values.
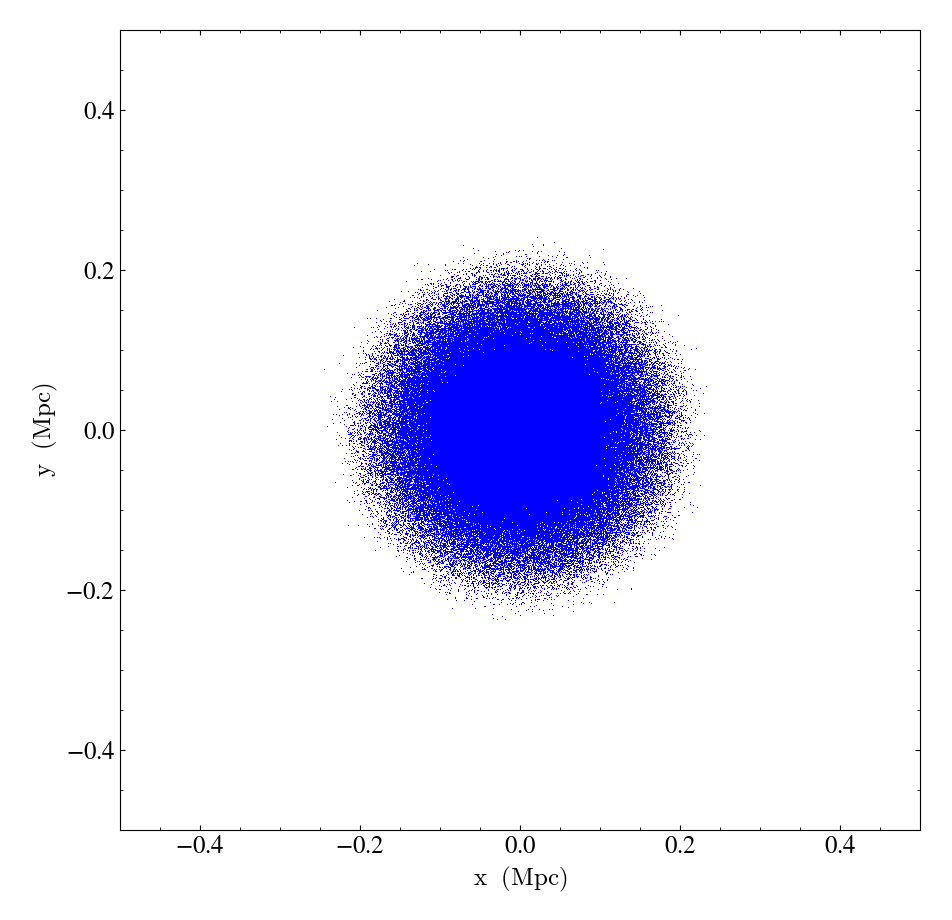
Particle Plots
Slice and projection plots both provide a callback for over-plotting particle
positions onto gas fields. However, sometimes you want to plot the particle
quantities by themselves, perhaps because the gas fields are not relevant to
your use case, or perhaps because your dataset doesn’t contain any gas fields
in the first place. Additionally, you may want to plot your particles with a
third field, such as particle mass or age, mapped to a colorbar.
ParticlePlot provides a convenient
way to do this in yt.
The easiest way to make a ParticlePlot
is to use the convenience routine. This has the syntax:
p = yt.ParticlePlot(ds, ("all", "particle_position_x"), ("all", "particle_position_y"))
p.save()
Here, ds is a dataset we’ve previously opened. The commands create a particle
plot that shows the x and y positions of all the particles in ds and save the
result to a file on the disk. The type of plot returned depends on the fields you
pass in; in this case, p will be an ParticleProjectionPlot,
because the fields are aligned to the coordinate system of the simulation.
The above example is equivalent to the following:
p = yt.ParticleProjectionPlot(ds, "z")
p.save()
Most of the callbacks the work for slice and projection plots also work for
ParticleProjectionPlot.
For instance, we can zoom in:
p = yt.ParticlePlot(ds, ("all", "particle_position_x"), ("all", "particle_position_y"))
p.zoom(10)
p.save("zoom")
change the width:
p.set_width((500, "kpc"))
or change the axis units:
p.set_unit(("all", "particle_position_x"), "Mpc")
Here is a full example that shows the simplest way to use
ParticlePlot:
import yt

ds = yt.load("IsolatedGalaxy/galaxy0030/galaxy0030")
p = yt.ParticlePlot(ds, ("all", "particle_position_x"), ("all", "particle_position_y"))
p.save()
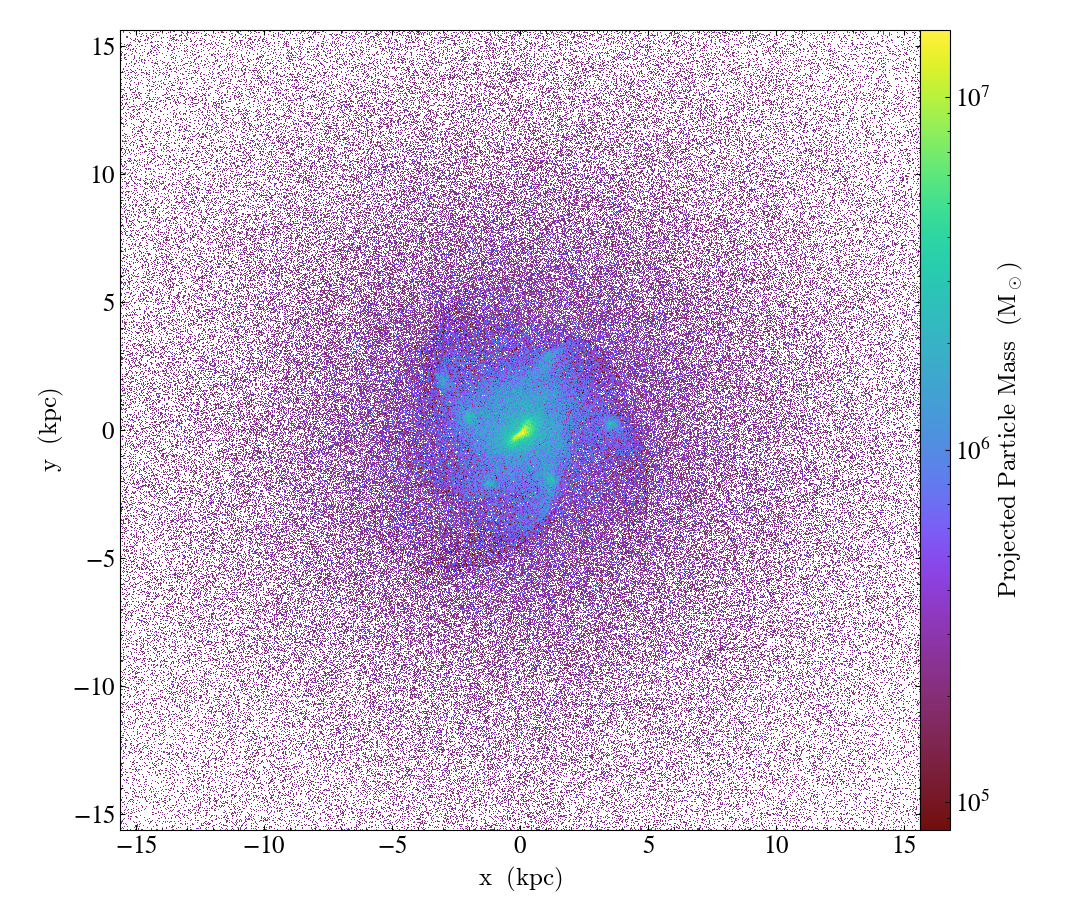
In the above examples, we are simply splatting particle x and y positions onto
a plot using some color. Colors can be applied to the plotted particles by
providing a z_field, which will be summed along the line of sight in a manner
similar to a projection.
import yt
ds = yt.load("IsolatedGalaxy/galaxy0030/galaxy0030")
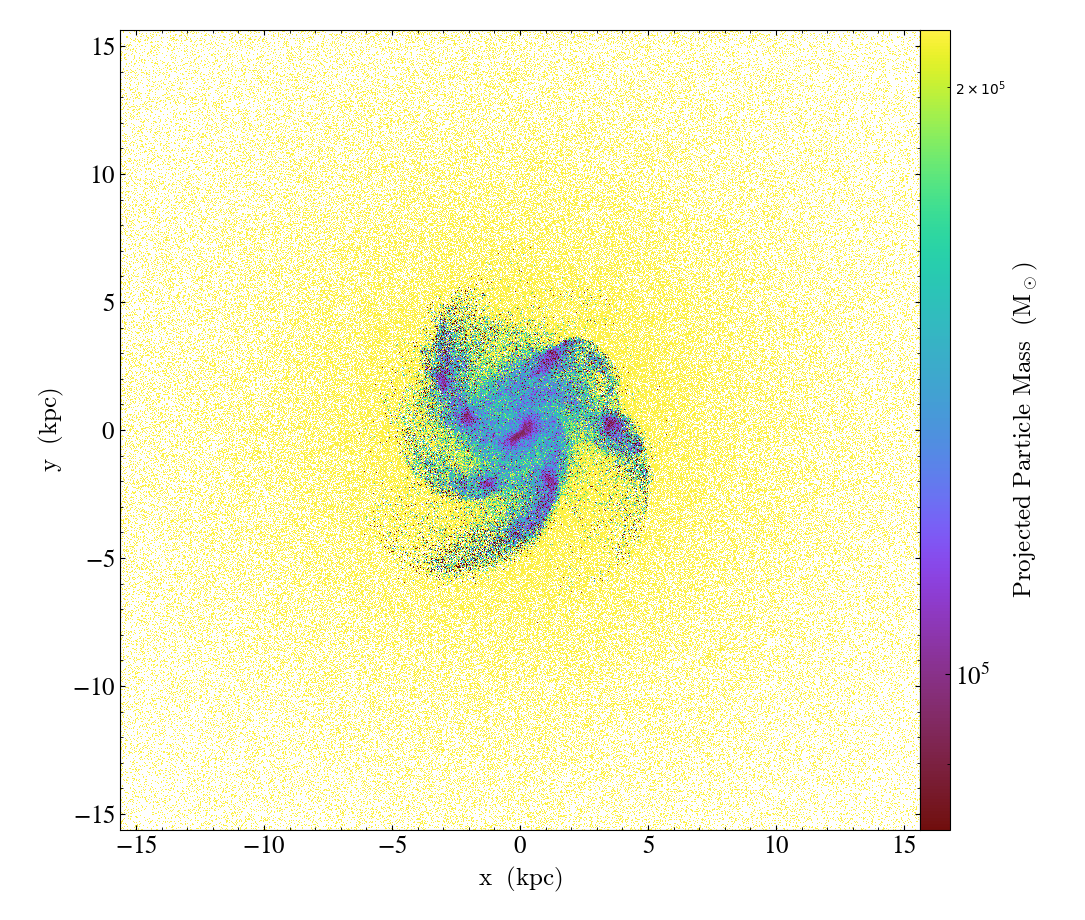
p = yt.ParticlePlot(ds, ("all", "particle_position_x"), ("all", "particle_position_y"), ("all", "particle_mass"))
p.set_unit(("all", "particle_mass"), "Msun")
p.zoom(32)
p.save()
Additionally, a weight_field can be given such that the value in each
pixel is the weighted average along the line of sight.
import yt

ds = yt.load("IsolatedGalaxy/galaxy0030/galaxy0030")
p = yt.ParticlePlot(
    ds,
    ("all", "particle_position_x"),
    ("all", "particle_position_y"),
    ("all", "particle_mass"),
    weight_field=("all", "particle_ones"),
)
p.set_unit(("all", "particle_mass"), "Msun")
p.zoom(32)
p.save()
Note the difference in the above two plots. The first shows the total mass along the line of sight. The density is higher in the inner regions, and hence there are more particles and more mass along the line of sight. The second plot shows the average mass per particle along the line of sight. The inner region is dominated by low mass star particles, whereas the outer region is comprised of higher mass dark matter particles.
Both ParticleProjectionPlot and
ParticlePhasePlot objects
accept a deposition argument which controls the order of the “splatting”
of the particles onto the pixels in the plot. The default option, "ngp",
corresponds to the “Nearest-Grid-Point” (0th-order) method, which simply
finds the pixel the particle is located in and deposits 100% of the particle
or its plotted quantity into that pixel. The other option, "cic",
corresponds to the “Cloud-In-Cell” (1st-order) method, which linearly
interpolates the particle or its plotted quantity into the four nearest
pixels in the plot.
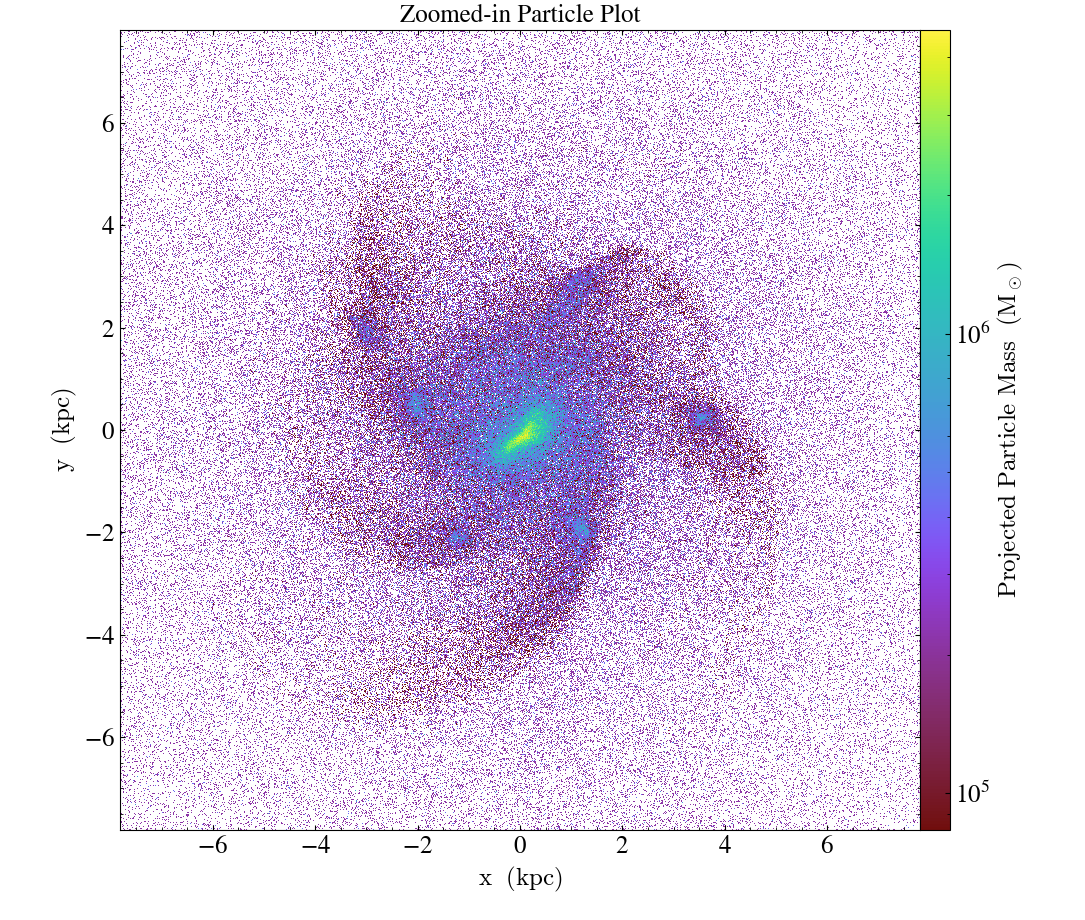
Here is a complete example that uses the particle_mass field
to set the colorbar and shows off some of the modification functions for
ParticleProjectionPlot:
import yt

ds = yt.load("IsolatedGalaxy/galaxy0030/galaxy0030")
p = yt.ParticlePlot(
    ds,
    ("all", "particle_position_x"),
    ("all", "particle_position_y"),
    ("all", "particle_mass"),
    width=(0.5, 0.5),
)
p.set_unit(("all", "particle_mass"), "Msun")
p.zoom(32)
p.annotate_title("Zoomed-in Particle Plot")
p.save()
If the fields passed in to ParticlePlot
do not correspond to a valid ParticleProjectionPlot,
a ParticlePhasePlot will be returned instead.
ParticlePhasePlot is used to plot arbitrary particle
fields against each other, and do not support some of the callbacks available in
ParticleProjectionPlot -
for instance, pan() and
zoom() don’t make much sense when of your axes is a position
and the other is a velocity. The modification functions defined for PhasePlot
should all work, however.
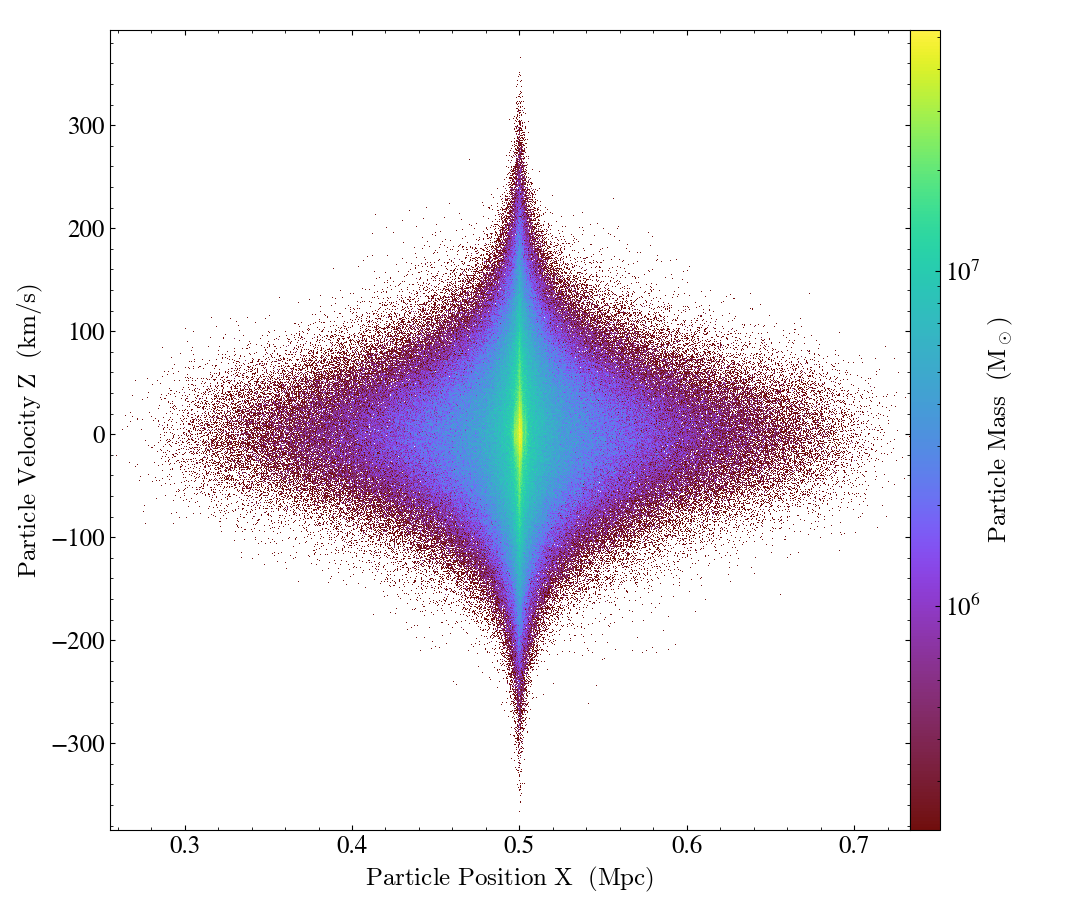
Here is an example of making a ParticlePhasePlot
of particle_position_x versus particle_velocity_z, with the particle_mass on the colorbar:
import yt

ds = yt.load("IsolatedGalaxy/galaxy0030/galaxy0030")
p = yt.ParticlePlot(ds, ("all", "particle_position_x"), ("all", "particle_velocity_z"), ("all", "particle_mass"))
p.set_unit(("all", "particle_position_x"), "Mpc")
p.set_unit(("all", "particle_velocity_z"), "km/s")
p.set_unit(("all", "particle_mass"), "Msun")
p.save()
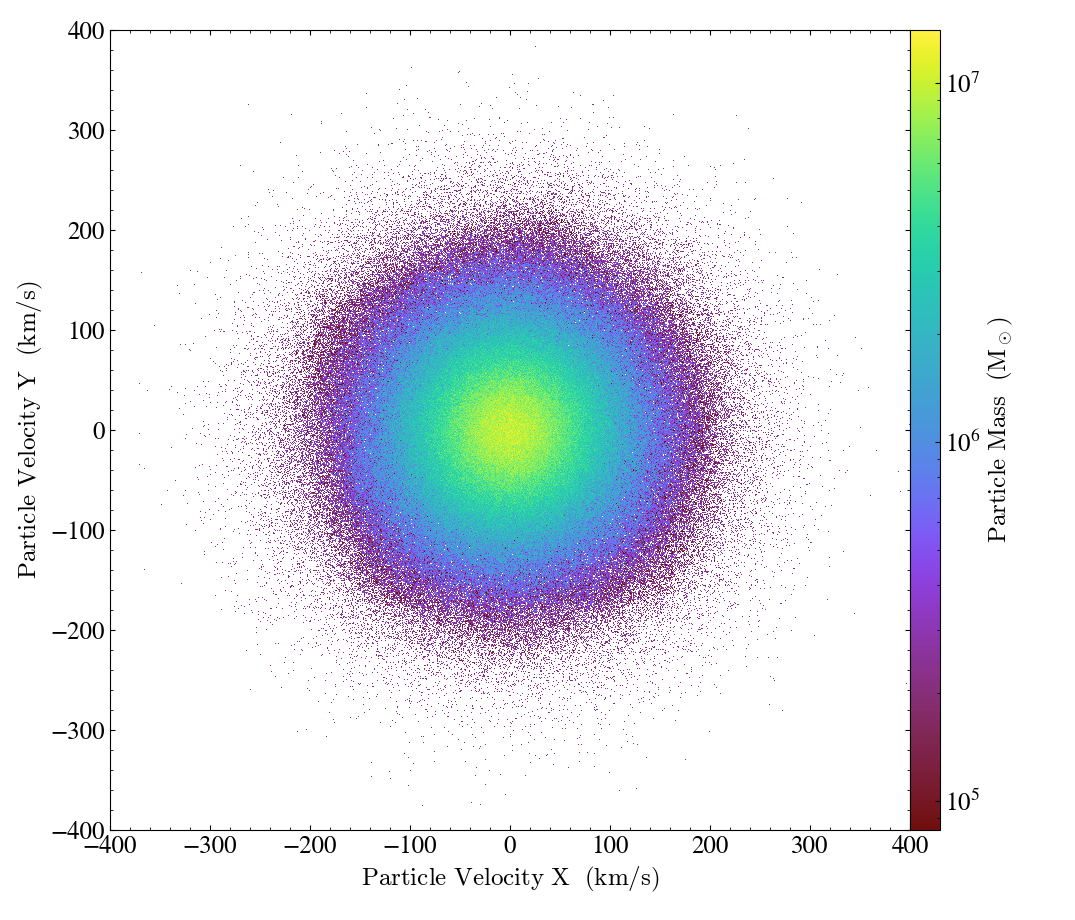
and here is one with the particle x and y velocities on the plot axes:
import yt

ds = yt.load("IsolatedGalaxy/galaxy0030/galaxy0030")
p = yt.ParticlePlot(ds, ("all", "particle_velocity_x"), ("all", "particle_velocity_y"), ("all", "particle_mass"))
p.set_unit(("all", "particle_velocity_x"), "km/s")
p.set_unit(("all", "particle_velocity_y"), "km/s")
p.set_unit(("all", "particle_mass"), "Msun")
p.set_ylim(-400, 400)
p.set_xlim(-400, 400)
p.save()
If you want more control over the details of the ParticleProjectionPlot or
ParticlePhasePlot, you can always use these classes directly. For instance,
here is an example of using the depth argument to ParticleProjectionPlot
to only plot the particles that live in a thin slice around the center of the
domain:
import yt

ds = yt.load("IsolatedGalaxy/galaxy0030/galaxy0030")

p = yt.ParticleProjectionPlot(ds, 2, [("all", "particle_mass")], width=(0.5, 0.5), depth=0.01)
p.set_unit(("all", "particle_mass"), "Msun")
p.save()
Using ParticleProjectionPlot, you can also plot particles
along an off-axis direction:
import yt

ds = yt.load("IsolatedGalaxy/galaxy0030/galaxy0030")

L = [1, 1, 1] # normal or "line of sight" vector
N = [0, 1, 0] # north or "up" vector

 p = yt.ParticleProjectionPlot(
     ds, L, [("all", "particle_mass")], width=(0.05, 0.05), depth=0.3, north_vector=N
 )
p.set_unit(("all", "particle_mass"), "Msun")
p.save()
Here is an example of using the data_source argument to ParticlePhasePlot
to only consider the particles that lie within a 50 kpc sphere around the domain center:
import yt

ds = yt.load("IsolatedGalaxy/galaxy0030/galaxy0030")

my_sphere = ds.sphere("c", (50.0, "kpc"))

p = yt.ParticlePhasePlot(
    my_sphere,
    ("all", "particle_velocity_x"),
    ("all", "particle_velocity_y"),
    ("all", "particle_mass")
)
p.set_unit(("all", "particle_velocity_x"), "km/s")
p.set_unit(("all", "particle_velocity_y"), "km/s")
p.set_unit(("all", "particle_mass"), "Msun")
p.set_ylim(-400, 400)
p.set_xlim(-400, 400)

p.save()
ParticleProjectionPlot objects also admit a density
flag, which allows one to plot the surface density of a projected quantity. This simply divides
the quantity in each pixel of the plot by the area of that pixel. It also changes the label on the
colorbar to reflect the new units and the fact that it is a density. This may make most sense in
the case of plotting the projected particle mass, in which case you can plot the projected particle
mass density:
import yt

ds = yt.load("IsolatedGalaxy/galaxy0030/galaxy0030")

p = yt.ParticleProjectionPlot(ds, 2, [("all", "particle_mass")], width=(0.5, 0.5), density=True)
p.set_unit(("all", "particle_mass"), "Msun/kpc**2") # Note that the dimensions reflect the density flag
p.save()
Finally, with 1D and 2D Profiles, you can create a ParticleProfile
object separately using the create_profile() function, and then use it
create a ParticlePhasePlot object using the
from_profile() method. In this example,
we have also used the weight_field argument to compute the average particle_mass in each
pixel, instead of the total:
import yt

ds = yt.load("IsolatedGalaxy/galaxy0030/galaxy0030")

ad = ds.all_data()

profile = yt.create_profile(
    ad,
    [("all", "particle_velocity_x"), ("all", "particle_velocity_y")],
    [("all", "particle_mass")],
    n_bins=800,
    weight_field=("all", "particle_ones"),
)

p = yt.ParticlePhasePlot.from_profile(profile)
p.set_unit(("all", "particle_velocity_x"), "km/s")
p.set_unit(("all", "particle_velocity_y"), "km/s")
p.set_unit(("all", "particle_mass"), "Msun")
p.set_ylim(-400, 400)
p.set_xlim(-400, 400)
p.save()
Under the hood, the ParticleProfile class works a lot like a
Profile2D object, except that instead of just binning the
particle field, you can also use higher-order deposition functions like the cloud-in-cell
interpolant to spread out the particle quantities over a few cells in the profile. The
create_profile() will automatically detect when all the fields
you pass in are particle fields, and return a ParticleProfile
if that is the case. For a complete description of the ParticleProfile
class please consult the reference documentation.
Interactive Plotting
The best way to interactively plot data is through the IPython notebook. Many detailed tutorials on using the IPython notebook can be found at Notebook Tutorial. The simplest way to launch the notebook it is to type:
jupyter lab
at the command line. This will prompt you for a password (so that if you’re on a shared user machine no one else can pretend to be you!) and then spawn an IPython notebook you can connect to.
If you want to see yt plots inline inside your notebook, you need only create a
plot and then call .show() and the image will appear inline:
Saving Plots
If you want to save your yt plots, you have a couple of options for customizing
the plot filenames. If you don’t care what the filenames are, just calling the
save method with no additional arguments usually suffices:
import yt

ds = yt.load("GasSloshing/sloshing_nomag2_hdf5_plt_cnt_0100")
slc = yt.SlicePlot(ds, "z", [("gas", "kT"), ("gas", "density")], width=(500.0, "kpc"))
slc.save()
which will yield PNG plots with the filenames
$ ls \*.png
sloshing_nomag2_hdf5_plt_cnt_0100_Slice_z_density.png
sloshing_nomag2_hdf5_plt_cnt_0100_Slice_z_kT.png
which has a general form of
[dataset name]_[plot type]_[axis]_[field name].[suffix]
Calling save with a single argument or the name keyword argument
specifies an alternative name for the plot:
slc.save("bananas")
or
slc.save(name="bananas")
yields
$ ls \*.png
bananas_Slice_z_kT.png
bananas_Slice_z_density.png
If you call save with a full filename with a file suffix, the plot
will be saved with that filename:
slc.save("sloshing.png")
since this will take any field and plot it with this filename, it is
typically only useful if you are plotting one field. If you want to
simply change the image format of the plotted file, use the suffix
keyword:
slc.save(name="bananas", suffix="eps")
yielding
$ ls *.eps
bananas_Slice_z_kT.eps
bananas_Slice_z_density.eps
Remaking Figures from Plot Datasets
When working with datasets that are too large to be stored locally, making figures just right can be cumbersome as it requires continuously moving images somewhere they can be viewed. However, image creation is actually a two step process of first creating the projection, slice, or profile object, and then converting that object into an actual image. Fortunately, the hard part (creating slices, projections, profiles) can be separated from the easy part (generating images). The intermediate slice, projection, and profile objects can be saved as reloadable datasets, then handed back to the plotting machinery discussed here.
For slices and projections, the saveable object is associated with the
plot object as data_source. This can be saved with the
save_as_dataset() function. For
more information, see Saving Reloadable Data.
p = yt.ProjectionPlot(ds, "x", ("gas", "density"), weight_field=("gas", "density"))
fn = p.data_source.save_as_dataset()
This function will optionally take a filename keyword that follows
the same logic as discussed above in Saving Plots. The filename
to which the dataset was written will be returned.
Once saved, this file can be reloaded completely independently of the original dataset and given back to the plot function with the same arguments. One can now continue to tweak the figure to one’s liking.
new_ds = yt.load(fn)
new_p = yt.ProjectionPlot(
    new_ds, "x", ("gas", "density"), weight_field=("gas", "density")
)
new_p.save()
The same functionality is available for profile and phase plots. In
each case, a special data container, data, is given to the plotting
functions.
For ProfilePlot:
ad = ds.all_data()
p1 = yt.ProfilePlot(
    ad, ("gas", "density"), ("gas", "temperature"), weight_field=("gas", "mass")
)

# note that ProfilePlots can hold a list of profiles
fn = p1.profiles[0].save_as_dataset()

new_ds = yt.load(fn)
p2 = yt.ProfilePlot(
    new_ds.data,
    ("gas", "density"),
    ("gas", "temperature"),
    weight_field=("gas", "mass"),
)
p2.save()
For PhasePlot:
ad = ds.all_data()
p1 = yt.PhasePlot(
    ad, ("gas", "density"), ("gas", "temperature"), ("gas", "mass"), weight_field=None
)
fn = p1.profile.save_as_dataset()

new_ds = yt.load(fn)
p2 = yt.PhasePlot(
    new_ds.data,
    ("gas", "density"),
    ("gas", "temperature"),
    ("gas", "mass"),
    weight_field=None,
)
p2.save()
Publication-ready Figures
While the routines above give a convenient method to inspect and
visualize your data, publishers often require figures to be in PDF or
EPS format. While the matplotlib supports vector graphics and image
compression in PDF formats, it does not support compression in EPS
formats. The DualEPS module
provides an interface with the PyX,
which is a Python abstraction of the PostScript drawing model with a
LaTeX interface. It is optimal for publications to provide figures
with vector graphics to avoid rasterization of the lines and text,
along with compression to produce figures that do not have a large
filesize.
Note
PyX must be installed, which can be accomplished either manually
with python -m pip install pyx.
This module can take any of the plots mentioned above and create an EPS or PDF figure. For example,
import yt.visualization.eps_writer as eps

slc = yt.SlicePlot(ds, "z", ("gas", "density"))
slc.set_width(25, "kpc")
eps_fig = eps.single_plot(slc)
eps_fig.save_fig("zoom", format="eps")
eps_fig.save_fig("zoom-pdf", format="pdf")
The eps_fig object exposes all of the low-level functionality of
PyX for further customization (see the PyX documentation). There are a few
convenience routines in eps_writer, such as drawing a circle,
eps_fig.circle(radius=0.2, loc=(0.5, 0.5))
eps_fig.sav_fig("zoom-circle", format="eps")
with a radius of 0.2 at a center of (0.5, 0.5), both of which are in
units of the figure’s field of view. The
multiplot_yt() routine also
provides a convenient method to produce multi-panel figures
from a PlotWindow. For example,
import yt
import yt.visualization.eps_writer as eps

slc = yt.SlicePlot(
    ds,
    "z",
    [
        ("gas", "density"),
        ("gas", "temperature"),
        ("gas", "pressure"),
        ("gas", "velocity_magnitude"),
    ],
)
slc.set_width(25, "kpc")
eps_fig = eps.multiplot_yt(2, 2, slc, bare_axes=True)
eps_fig.scale_line(0.2, "5 kpc")
eps_fig.save_fig("multi", format="eps")
will produce a 2x2 panel figure with a scale bar indicating 5 kpc.
The routine will try its best to place the colorbars in the optimal
margin, but it can be overridden by providing the keyword
cb_location with a dict of either right, left, top, bottom
with the fields as the keys.
You can also combine slices, projections, and phase plots. Here is an example that includes slices and phase plots:
from yt import PhasePlot, SlicePlot
from yt.visualization.eps_writer import multiplot_yt

ds = yt.load("IsolatedGalaxy/galaxy0030/galaxy0030")

p1 = SlicePlot(ds, "x", ("gas", "density"))
p1.set_width(10, "kpc")

p2 = SlicePlot(ds, "x", ("gas", "temperature"))
p2.set_width(10, "kpc")
p2.set_cmap(("gas", "temperature"), "hot")

sph = ds.sphere(ds.domain_center, (10, "kpc"))
p3 = PhasePlot(
    sph,
    "radius",
    ("gas", "density"),
    ("gas", "temperature"),
    weight_field=("gas", "mass"),
)

p4 = PhasePlot(
    sph, "radius", ("gas", "density"), ("gas", "pressure"), weight_field=("gas", "mass")
)

mp = multiplot_yt(
    2,
    2,
    [p1, p2, p3, p4],
    savefig="yt",
    shrink_cb=0.9,
    bare_axes=False,
    yt_nocbar=False,
    margins=(0.5, 0.5),
)

mp.save_fig("multi_slice_phase")
Using yt’s style with matplotlib
It is possible to use yt’s plot style in outside of yt itself, with the
matplotlib_style_context() context manager
import matplotlib.pyplot as plt
import numpy as np
import yt

plt.rcParams["font.size"] = 14

x = np.linspace(-np.pi, np.pi, 100)
y = np.sin(x)

with yt.funcs.matplotlib_style_context():
    fig, ax = plt.subplots()
    ax.plot(x, y)
    ax.set(
        xlabel=r"$x$",
        ylabel=r"$y$",
        title="A yt-styled matplotlib figure",
    )
Note that matplotlib_style_context() doesn’t control the font
size, so we adjust it manually in the preamble.
With matplotlib 3.7 and newer, you can avoid importing yt altogether
# requires matplotlib>=3.7
import matplotlib.pyplot as plt
import numpy as np

plt.rcParams["font.size"] = 14

x = np.linspace(-np.pi, np.pi, 100)
y = np.sin(x)

with plt.style.context("yt.default"):
    fig, ax = plt.subplots()
    ax.plot(x, y)
    ax.set(
        xlabel=r"$x$",
        ylabel=r"$y$",
        title="A yt-styled matplotlib figure",
    )
and you can also enable yt’s style without a context manager as
# requires matplotlib>=3.7
import matplotlib.pyplot as plt
import numpy as np

plt.style.use("yt.default")
plt.rcParams["font.size"] = 14

x = np.linspace(-np.pi, np.pi, 100)
y = np.sin(x)

fig, ax = plt.subplots()
ax.plot(x, y)
ax.set(
    xlabel=r"$x$",
    ylabel=r"$y$",
    title="A yt-styled matplotlib figure",
)
For more details, see matplotlib’s documentation <https://matplotlib.org/stable/tutorials/introductory/customizing.html#customizing-with-style-sheets>_