Particle Trajectories
One can create particle trajectories from a DatasetSeries object for a specified list of particles identified by their unique indices using the particle_trajectories method.
[1]:
%matplotlib inline
import glob
from os.path import join

import yt
from yt.config import ytcfg

path = ytcfg.get("yt", "test_data_dir")
import matplotlib.pyplot as plt
First, let’s start off with a FLASH dataset containing only two particles in a mutual circular orbit. We can get the list of filenames this way:
[2]:
my_fns = glob.glob(join(path, "Orbit", "orbit_hdf5_chk_00[0-9][0-9]"))
my_fns.sort()
And let’s define a list of fields that we want to include in the trajectories. The position fields will be included by default, so let’s just ask for the velocity fields:
[3]:
fields = ["particle_velocity_x", "particle_velocity_y", "particle_velocity_z"]
There are only two particles, but for consistency’s sake let’s grab their indices from the dataset itself:
[4]:
ds = yt.load(my_fns[0])
dd = ds.all_data()
indices = dd["all", "particle_index"].astype("int")
print(indices)
[1 2] dimensionless
which is what we expected them to be. Now we’re ready to create a DatasetSeries object and use it to create particle trajectories:
[5]:
ts = yt.DatasetSeries(my_fns)
# suppress_logging=True cuts down on a lot of noise
trajs = ts.particle_trajectories(indices, fields=fields, suppress_logging=True)
The ParticleTrajectories object trajs is essentially a dictionary-like container for the particle fields along the trajectory, and can be accessed as such:
[6]:
print(trajs["all", "particle_position_x"])
print(trajs["all", "particle_position_x"].shape)
[[0.25       0.25131274 0.25524942 0.26175659 0.27075597 0.28215068
  0.2958247  0.31164457 0.32945507 0.3491025  0.37039668 0.39309658
  0.41697977 0.44181091 0.46731412 0.49320738 0.51918241 0.54492553
  0.57013802 0.5945386  0.61785738 0.63986883 0.66032111 0.67898584
  0.69568959 0.71026758 0.72255999 0.73244151 0.73979734 0.7445359
  0.74658248]
 [0.75       0.74868726 0.74475058 0.7382434  0.72924402 0.71784928
  0.70417524 0.68835534 0.67054478 0.65089727 0.62960299 0.60690298
  0.58301967 0.5581884  0.53268507 0.50679169 0.48081655 0.45507332
  0.42986072 0.40546004 0.38214117 0.36012962 0.33967725 0.32101242
  0.30430854 0.28973042 0.27743785 0.26755617 0.26020016 0.25546143
  0.25341467]] code_length
(2, 31)
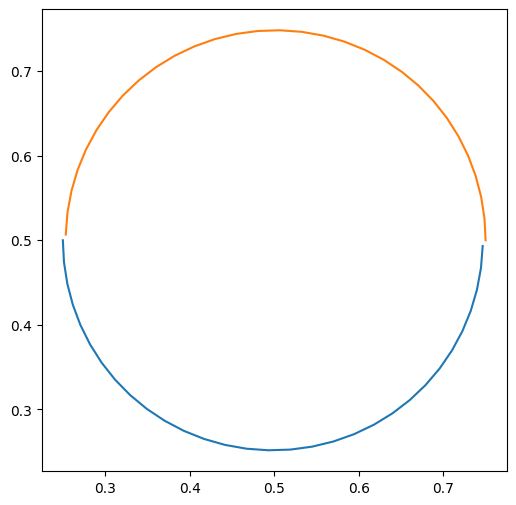
Note that each field is a 2D NumPy array with the different particle indices along the first dimension and the times along the second dimension. As such, we can access them individually by indexing the field:
[7]:
plt.figure(figsize=(6, 6))
plt.plot(trajs["all", "particle_position_x"][0], trajs["all", "particle_position_y"][0])
plt.plot(trajs["all", "particle_position_x"][1], trajs["all", "particle_position_y"][1])
[7]:
[<matplotlib.lines.Line2D at 0x7f746ad1d090>]

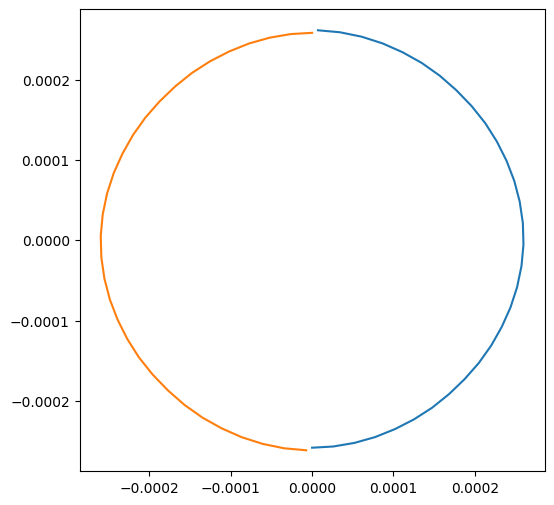
And we can plot the velocity fields as well:
[8]:
plt.figure(figsize=(6, 6))
plt.plot(trajs["all", "particle_velocity_x"][0], trajs["all", "particle_velocity_y"][0])
plt.plot(trajs["all", "particle_velocity_x"][1], trajs["all", "particle_velocity_y"][1])
[8]:
[<matplotlib.lines.Line2D at 0x7f746c5c7150>]

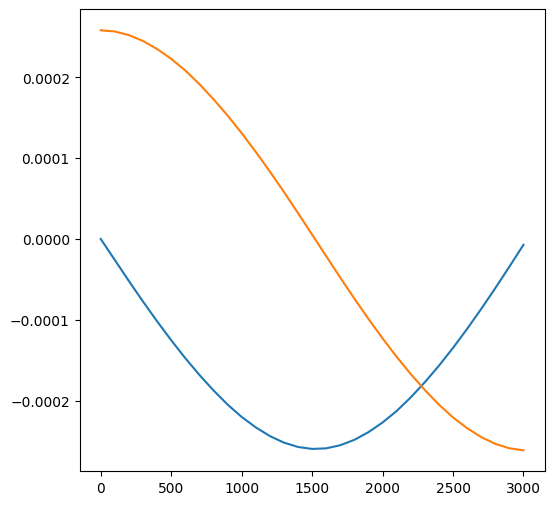
If we want to access the time along the trajectory, we use the key "particle_time":
[9]:
plt.figure(figsize=(6, 6))
plt.plot(trajs["particle_time"], trajs["particle_velocity_x"][1])
plt.plot(trajs["particle_time"], trajs["particle_velocity_y"][1])
[9]:
[<matplotlib.lines.Line2D at 0x7f746c556c50>]

Alternatively, if we know the particle index we’d like to examine, we can get an individual trajectory corresponding to that index:
[10]:
particle1 = trajs.trajectory_from_index(1)
plt.figure(figsize=(6, 6))
plt.plot(particle1["all", "particle_time"], particle1["all", "particle_position_x"])
plt.plot(particle1["all", "particle_time"], particle1["all", "particle_position_y"])
---------------------------------------------------------------------------
TypeError                                 Traceback (most recent call last)
Cell In[10], line 1
----> 1 particle1 = trajs.trajectory_from_index(1)
      2 plt.figure(figsize=(6, 6))
      3 plt.plot(particle1["all", "particle_time"], particle1["all", "particle_position_x"])

File /tmp/yt/yt/data_objects/particle_trajectories.py:340, in ParticleTrajectories.trajectory_from_index(self, index)
    338     print("The particle index %d is not in the list!" % (index))
    339     raise IndexError
--> 340 fields = sorted(self.field_data.keys())
    341 traj = {}
    342 traj[self.ptype, "particle_time"] = self.times

TypeError: '<' not supported between instances of 'str' and 'tuple'
Now let’s look at a more complicated (and fun!) example. We’ll use an Enzo cosmology dataset. First, we’ll find the maximum density in the domain, and obtain the indices of the particles within some radius of the center. First, let’s have a look at what we’re getting:
[11]:
ds = yt.load("enzo_tiny_cosmology/DD0046/DD0046")
slc = yt.SlicePlot(
    ds,
    "x",
    [("gas", "density"), ("gas", "dark_matter_density")],
    center="max",
    width=(3.0, "Mpc"),
)
slc.show()
So far, so good–it looks like we’ve centered on a galaxy cluster. Let’s grab all of the dark matter particles within a sphere of 0.5 Mpc (identified by "particle_type == 1"):
[12]:
sp = ds.sphere("max", (0.5, "Mpc"))
indices = sp["all", "particle_index"][sp["all", "particle_type"] == 1]
Next we’ll get the list of datasets we want, and create trajectories for these particles:
[13]:
my_fns = glob.glob(join(path, "enzo_tiny_cosmology/DD*/*.hierarchy"))
my_fns.sort()
ts = yt.DatasetSeries(my_fns)
trajs = ts.particle_trajectories(indices, fields=fields, suppress_logging=True)
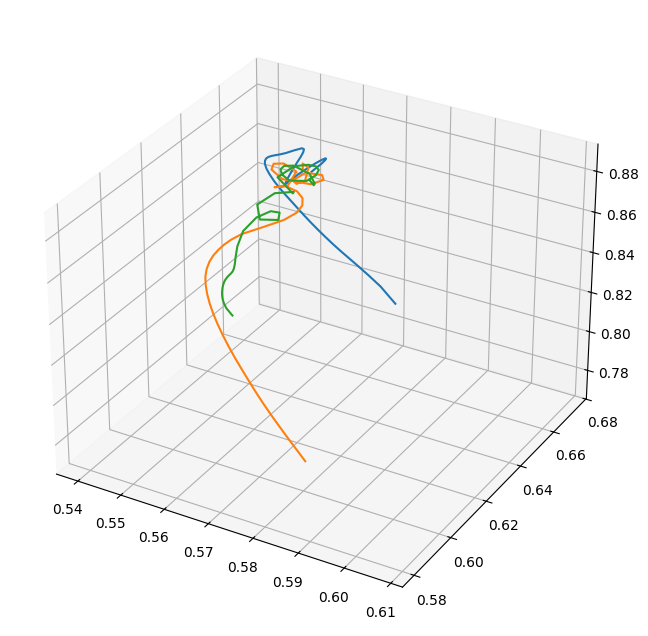
Matplotlib can make 3D plots, so let’s pick three particle trajectories at random and look at them in the volume:
[14]:
fig = plt.figure(figsize=(8.0, 8.0))
ax = fig.add_subplot(111, projection="3d")
ax.plot(
    trajs["all", "particle_position_x"][100],
    trajs["all", "particle_position_y"][100],
    trajs["all", "particle_position_z"][100],
)
ax.plot(
    trajs["all", "particle_position_x"][8],
    trajs["all", "particle_position_y"][8],
    trajs["all", "particle_position_z"][8],
)
ax.plot(
    trajs["all", "particle_position_x"][25],
    trajs["all", "particle_position_y"][25],
    trajs["all", "particle_position_z"][25],
)
[14]:
[<mpl_toolkits.mplot3d.art3d.Line3D at 0x7f7466cfdd50>]

It looks like these three different particles fell into the cluster along different filaments. We can also look at their x-positions only as a function of time:
[15]:
plt.figure(figsize=(6, 6))
plt.plot(trajs["all", "particle_time"], trajs["all", "particle_position_x"][100])
plt.plot(trajs["all", "particle_time"], trajs["all", "particle_position_x"][8])
plt.plot(trajs["all", "particle_time"], trajs["all", "particle_position_x"][25])
---------------------------------------------------------------------------
YTFieldNotFound                           Traceback (most recent call last)
Cell In[15], line 2
      1 plt.figure(figsize=(6, 6))
----> 2 plt.plot(trajs["all", "particle_time"], trajs["all", "particle_position_x"][100])
      3 plt.plot(trajs["all", "particle_time"], trajs["all", "particle_position_x"][8])
      4 plt.plot(trajs["all", "particle_time"], trajs["all", "particle_position_x"][25])

File /tmp/yt/yt/data_objects/particle_trajectories.py:162, in ParticleTrajectories.__getitem__(self, key)
    160     return self.times
    161 if key not in self.field_data:
--> 162     self._get_data([key])
    163 return self.field_data[key]

File /tmp/yt/yt/data_objects/particle_trajectories.py:234, in ParticleTrajectories._get_data(self, fields)
    232 new_particle_fields = []
    233 for field in missing_fields:
--> 234     fds[field] = dd_first._determine_fields(field)[0]
    235     if field not in self.particle_fields:
    236         ftype = fds[field][0]

File /tmp/yt/yt/data_objects/data_containers.py:1471, in YTDataContainer._determine_fields(self, fields)
   1468     explicit_fields.append(field)
   1469     continue
-> 1471 finfo = self.ds._get_field_info(field)
   1472 ftype, fname = finfo.name
   1473 # really ugly check to ensure that this field really does exist somewhere,
   1474 # in some naming convention, before returning it as a possible field type

File /tmp/yt/yt/data_objects/static_output.py:953, in Dataset._get_field_info(self, field)
    948 def _get_field_info(
    949     self,
    950     field: FieldKey | ImplicitFieldKey | DerivedField,
    951     /,
    952 ) -> DerivedField:
--> 953     field_info, candidates = self._get_field_info_helper(field)
    955     if field_info.name[1] in ("px", "py", "pz", "pdx", "pdy", "pdz"):
    956         # escape early as a bandaid solution to
    957         # https://github.com/yt-project/yt/issues/3381
    958         return field_info

File /tmp/yt/yt/data_objects/static_output.py:1046, in Dataset._get_field_info_helper(self, field)
   1043 elif (ftype, fname) in self.field_info:
   1044     return self.field_info[ftype, fname], []
-> 1046 raise YTFieldNotFound(field, ds=self)

YTFieldNotFound: Could not find field ('all', 'particle_time') in DD0000.
Did you mean:
        ('all', 'particle_type')
<Figure size 600x600 with 0 Axes>
Suppose we wanted to know the gas density along the particle trajectory, but there wasn’t a particle field corresponding to that in our dataset. Never fear! If the field exists as a grid field, yt will interpolate this field to the particle positions and add the interpolated field to the trajectory. To add such a field (or any field, including additional particle fields) we can call the add_fields method:
[16]:
trajs.add_fields([("gas", "density")])
---------------------------------------------------------------------------
KeyError                                  Traceback (most recent call last)
Cell In[16], line 1
----> 1 trajs.add_fields([("gas", "density")])

File /tmp/yt/yt/data_objects/particle_trajectories.py:212, in ParticleTrajectories.add_fields(self, fields)
    197 def add_fields(self, fields):
    198     """
    199     Add a list of fields to an existing trajectory
    200
   (...)
    210     >>> trajs.add_fields([("all", "particle_mass"), ("all", "particle_gpot")])
    211     """
--> 212     self._get_data(fields)

File /tmp/yt/yt/data_objects/particle_trajectories.py:271, in ParticleTrajectories._get_data(self, fields)
    269 for field in grid_fields:
    270     pfield[field] = np.zeros(self.num_indices)
--> 271 x = self["particle_position_x"][:, step].d
    272 y = self["particle_position_y"][:, step].d
    273 z = self["particle_position_z"][:, step].d

File /tmp/yt/yt/data_objects/particle_trajectories.py:162, in ParticleTrajectories.__getitem__(self, key)
    160     return self.times
    161 if key not in self.field_data:
--> 162     self._get_data([key])
    163 return self.field_data[key]

File /tmp/yt/yt/data_objects/particle_trajectories.py:302, in ParticleTrajectories._get_data(self, fields)
    300     fd = fds[field]
    301     for i, (_fn, (indices, pfield)) in enumerate(sorted(my_storage.items())):
--> 302         output_field[indices, i] = pfield[field]
    303     self.field_data[field] = array_like_field(dd_first, output_field.copy(), fd)
    305 if self.suppress_logging:

KeyError: 'particle_position_x'
We also could have included "density" in our original field list. Now, plot up the gas density for each particle as a function of time:
[17]:
plt.figure(figsize=(6, 6))
plt.plot(trajs["all", "particle_time"], trajs["gas", "density"][100])
plt.plot(trajs["all", "particle_time"], trajs["gas", "density"][8])
plt.plot(trajs["all", "particle_time"], trajs["gas", "density"][25])
plt.yscale("log")
---------------------------------------------------------------------------
YTFieldNotFound                           Traceback (most recent call last)
Cell In[17], line 2
      1 plt.figure(figsize=(6, 6))
----> 2 plt.plot(trajs["all", "particle_time"], trajs["gas", "density"][100])
      3 plt.plot(trajs["all", "particle_time"], trajs["gas", "density"][8])
      4 plt.plot(trajs["all", "particle_time"], trajs["gas", "density"][25])

File /tmp/yt/yt/data_objects/particle_trajectories.py:162, in ParticleTrajectories.__getitem__(self, key)
    160     return self.times
    161 if key not in self.field_data:
--> 162     self._get_data([key])
    163 return self.field_data[key]

File /tmp/yt/yt/data_objects/particle_trajectories.py:234, in ParticleTrajectories._get_data(self, fields)
    232 new_particle_fields = []
    233 for field in missing_fields:
--> 234     fds[field] = dd_first._determine_fields(field)[0]
    235     if field not in self.particle_fields:
    236         ftype = fds[field][0]

File /tmp/yt/yt/data_objects/data_containers.py:1471, in YTDataContainer._determine_fields(self, fields)
   1468     explicit_fields.append(field)
   1469     continue
-> 1471 finfo = self.ds._get_field_info(field)
   1472 ftype, fname = finfo.name
   1473 # really ugly check to ensure that this field really does exist somewhere,
   1474 # in some naming convention, before returning it as a possible field type

File /tmp/yt/yt/data_objects/static_output.py:953, in Dataset._get_field_info(self, field)
    948 def _get_field_info(
    949     self,
    950     field: FieldKey | ImplicitFieldKey | DerivedField,
    951     /,
    952 ) -> DerivedField:
--> 953     field_info, candidates = self._get_field_info_helper(field)
    955     if field_info.name[1] in ("px", "py", "pz", "pdx", "pdy", "pdz"):
    956         # escape early as a bandaid solution to
    957         # https://github.com/yt-project/yt/issues/3381
    958         return field_info

File /tmp/yt/yt/data_objects/static_output.py:1046, in Dataset._get_field_info_helper(self, field)
   1043 elif (ftype, fname) in self.field_info:
   1044     return self.field_info[ftype, fname], []
-> 1046 raise YTFieldNotFound(field, ds=self)

YTFieldNotFound: Could not find field ('all', 'particle_time') in DD0000.
Did you mean:
        ('all', 'particle_type')
<Figure size 600x600 with 0 Axes>
Finally, the particle trajectories can be written to disk. Two options are provided: ASCII text files with a column for each field and the time, and HDF5 files:
[18]:
trajs.write_out(
    "halo_trajectories"
)  # This will write a separate file for each trajectory
trajs.write_out_h5(
    "halo_trajectories.h5"
)  # This will write all trajectories to a single file
---------------------------------------------------------------------------
TypeError                                 Traceback (most recent call last)
Cell In[18], line 1
----> 1 trajs.write_out(
      2     "halo_trajectories"
      3 )  # This will write a separate file for each trajectory
      4 trajs.write_out_h5(
      5     "halo_trajectories.h5"
      6 )  # This will write all trajectories to a single file

File /tmp/yt/yt/utilities/parallel_tools/parallel_analysis_interface.py:364, in parallel_root_only.<locals>.root_only(*args, **kwargs)
    361 @wraps(func)
    362 def root_only(*args, **kwargs):
    363     if not parallel_capable:
--> 364         return func(*args, **kwargs)
    365     comm = _get_comm(args)
    366     rv = None

File /tmp/yt/yt/data_objects/particle_trajectories.py:365, in ParticleTrajectories.write_out(self, filename_base)
    348 @parallel_root_only
    349 def write_out(self, filename_base):
    350     """
    351     Write out particle trajectories to tab-separated ASCII files (one
    352     for each trajectory) with the field names in the file header. Each
   (...)
    363     >>> trajs.write_out("orbit_trajectory")
    364     """
--> 365     fields = sorted(self.field_data.keys())
    366     num_fields = len(fields)
    367     first_str = "# particle_time\t" + "\t".join(fields) + "\n"

TypeError: '<' not supported between instances of 'str' and 'tuple'