Gallery of Examples
Here are some examples of yt in the real world.
We welcome you to submit your own images made with yt from publications, talks, webpages, etc. Just fork our repository and issue a pull request with your image at the top of the page. Images should be about 400 pixels wide, and please include a link to any published work.
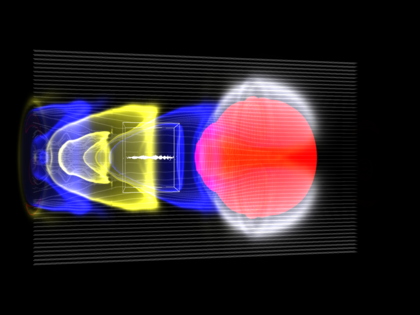
Mesh-refinement for laser-plasma interation simulations with WarpX
Yt was used to render this multi-stage laser-plasma acceleration simulation with the electromagnetic particle-in-cell code WarpX, see Vay et al. 2018. An ultrashort ultraintense laser pulse (red) propagates through a low-density plasma and triggers plasma oscillations with strong electric field (yellow-blue). A beam of electrons (white dots) is trapped in this wake and accelerated to high energies (GeV). The horizontal lines show lines of plasma particles. For higher accuracy, a refinement patch is added around the electron beam (white parallelepiped).
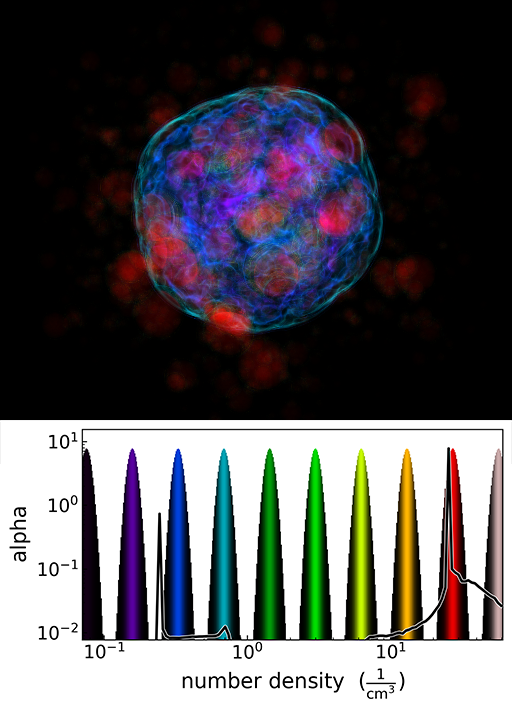
Mixed-morphology SNR simulations with a cloudy environment
In Zhang et al. 2019, authours used yt to present the 3D simulation of a mixed-morphology supernova remnant. The volumetric rendering of density shows in the top panel, with a density histogram (black curve) and the transfer function in the bottom panel. The SNR shock front is in cyan, and dense clouds are in red.
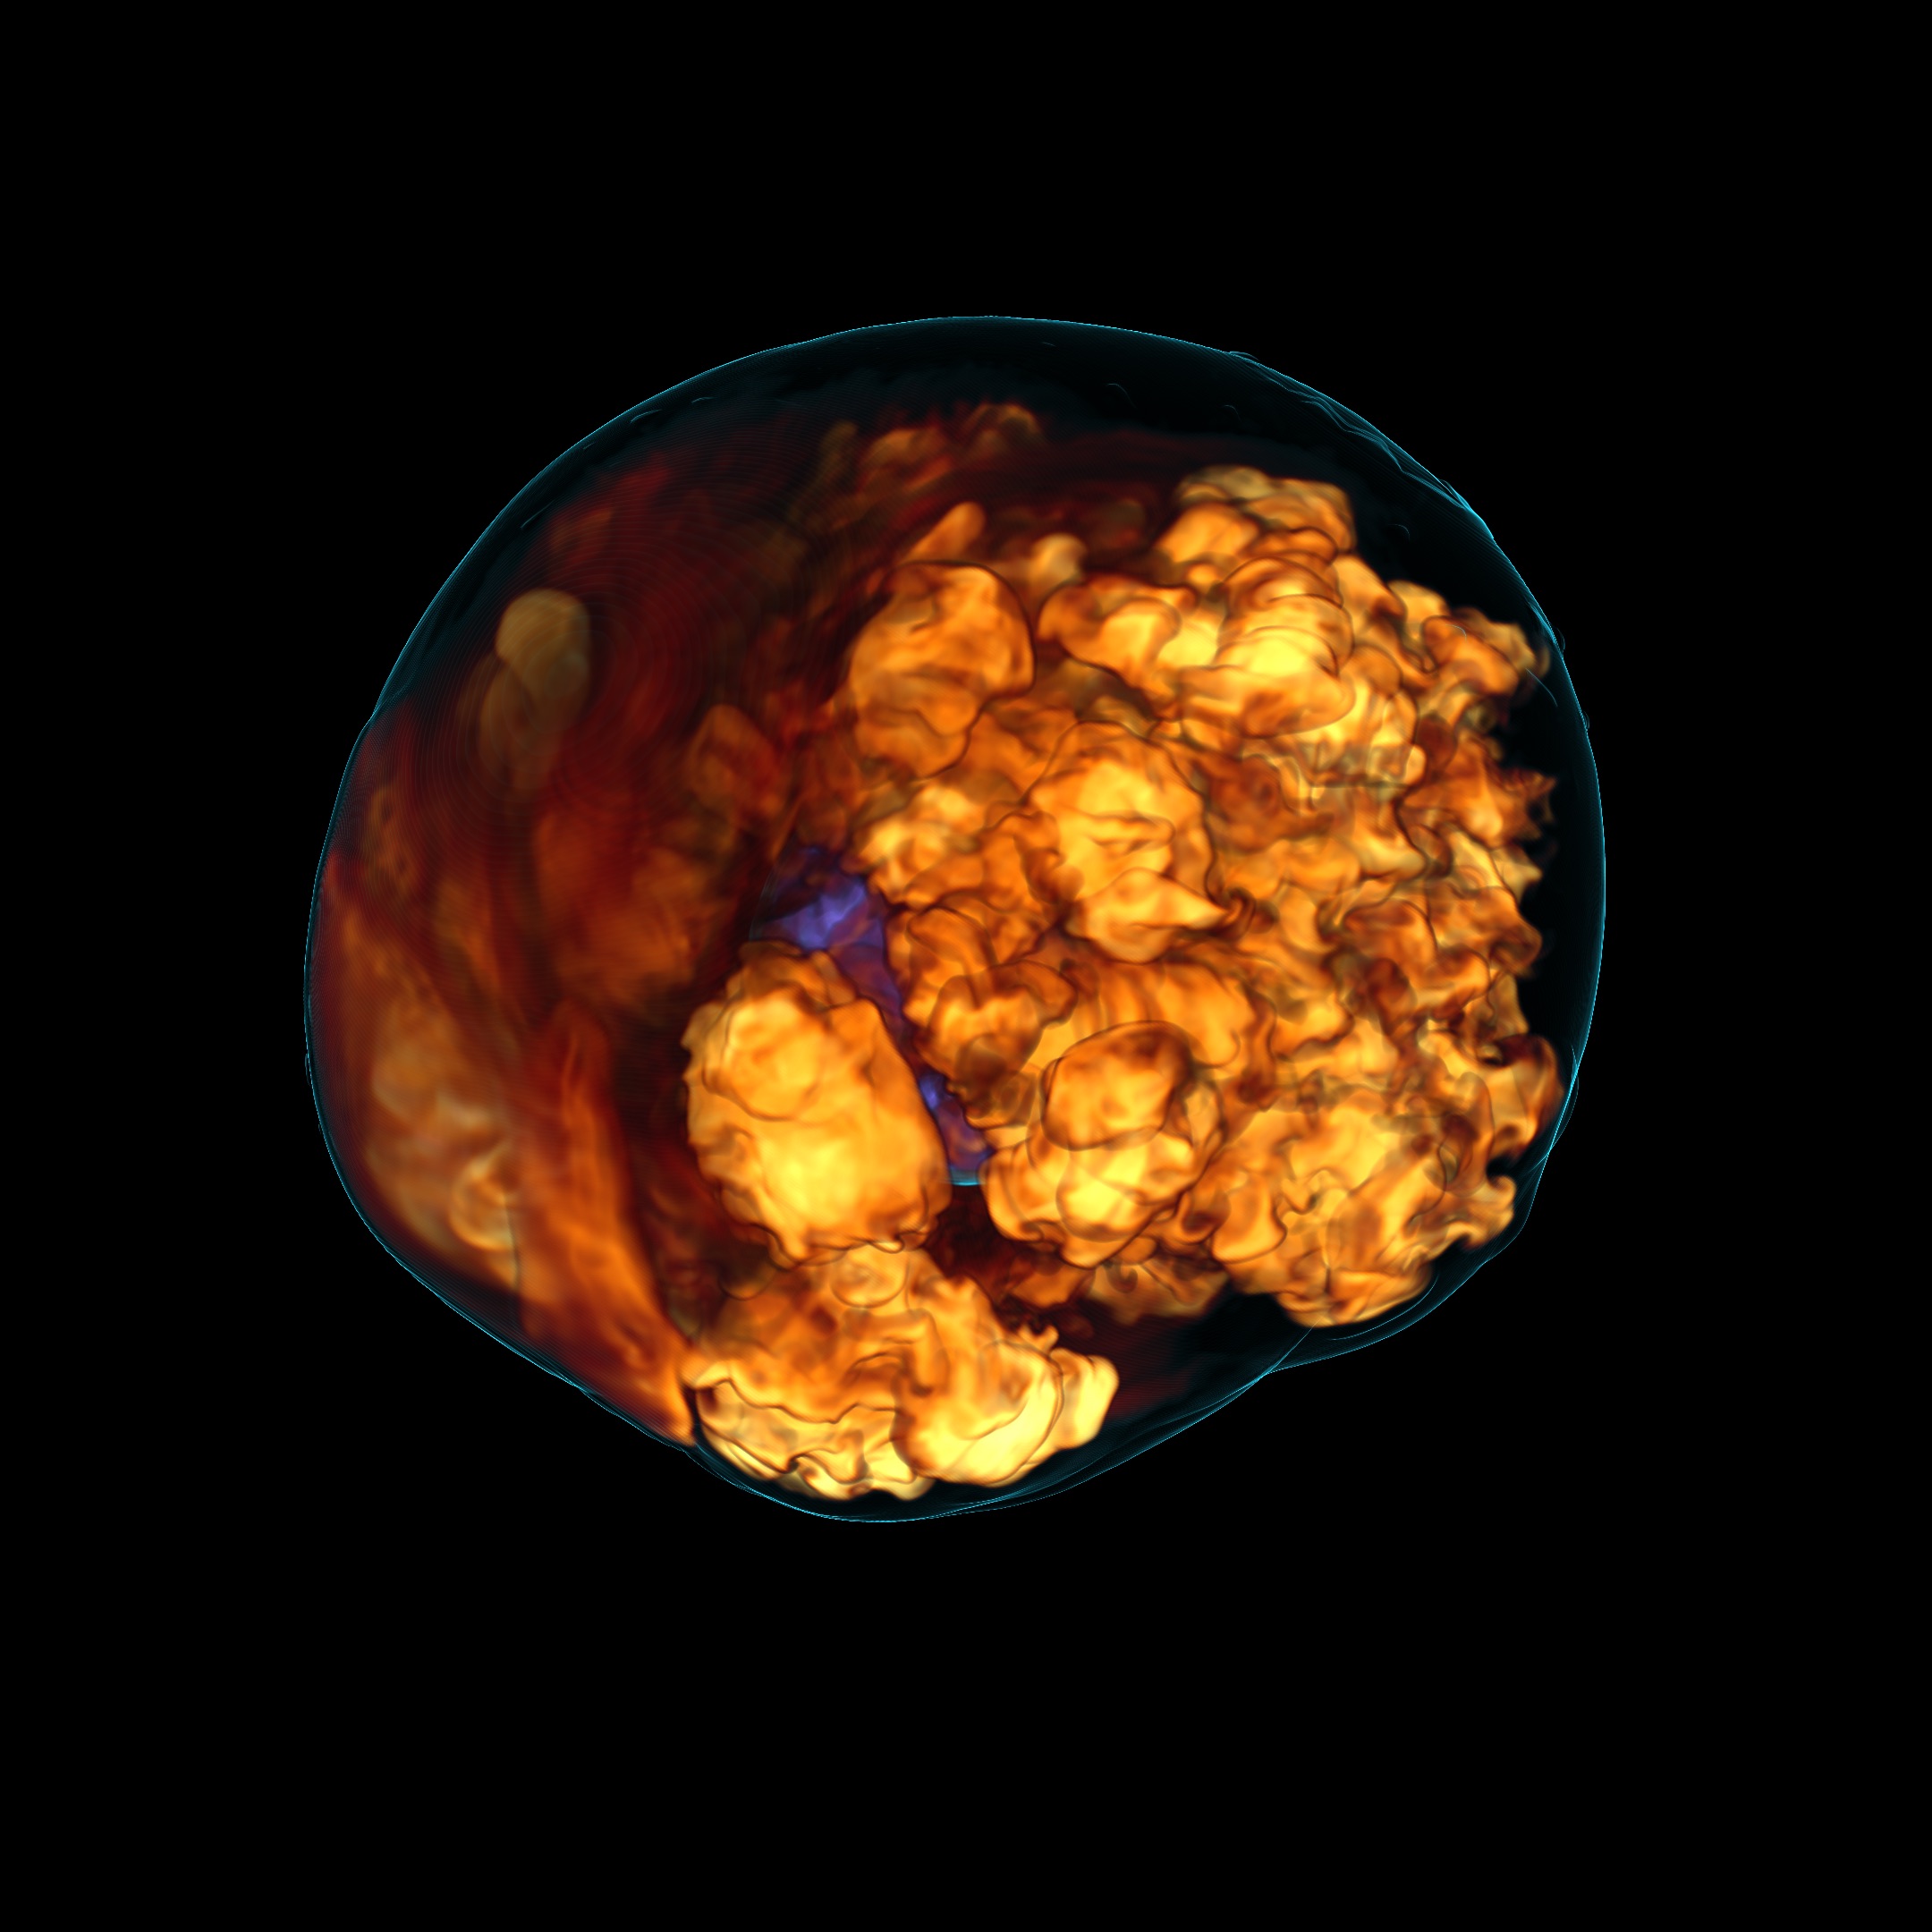
Standing Accretion Shock Instability Spiral Wave in a Core-Collapse Supernova Simulations
In O'Connor & Couch (2018), the authors used yt for the visualization of their data. This figure, a volume rendering of entropy near the gain region of a core-collapse supernova, shows the multidimensional hydrodynamic instabilities at work. Both turbulence and the standing accretion shock instability (the spiral wave wrapping around from the left) aid the neutrino mechanism in reviving the stalled shock.
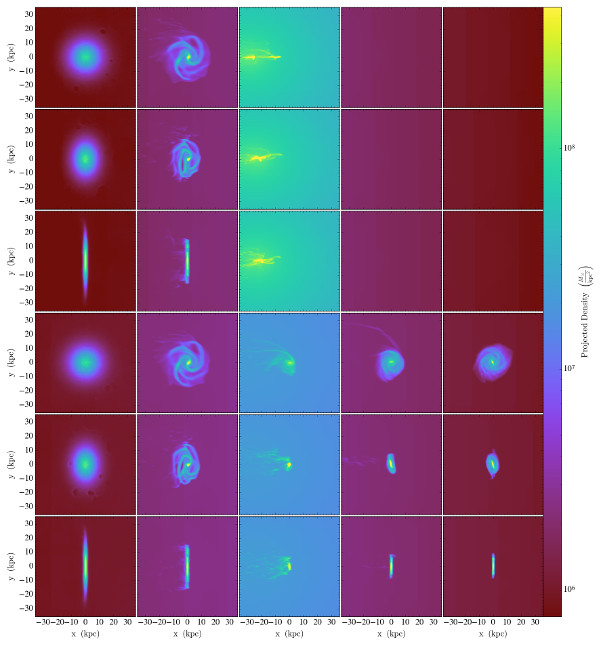
Ram Pressure Stripping of Galaxies in Clusters
In Ruggiero & Lima Neto (2017), the authors used yt to do all the analysis and visualization of their data. This figure shows gas density projections of a Milky Way like galaxy falling into a galaxy cluster with different entry speeds, for the case where the cluster has a cool-core (first three rows) or does not have a cool-core (last three rows).
NeuroDome
yt has been used to create volumetric renderings of human CT scans in support of the NeuroDome project. For more information, check out the NeuroDome website.
Integration of yt Surfaces in Blender
This movie was completely scripted in Blender using the AstroBlend python library, freely available artistic 3D galaxy models and yt-generated surfaces of a FLASH simulation. AstroBlend tutorials and examples are available on the AstroBlend website, which is still very much under construction. Paper due out at some point in the (hopefully) near future.
The First Star: Birth through Death
This movie was created completely with yt by Matthew Turk, John Wise, Sam Skillman, and Mark SubbaRao that shows a zoom-out of a collapsing metal-free halo and then transitions to another simulation that follows the main sequence and supernova of a metal-free star. The simulation shown in the first half was presented in Turk et al. (2009) and the latter simulation will be published shortly. This visualization won the Best Visualization Award at the XSEDE 13 conference and was exhibited at the Alder Planetarium.
Radiation Pressure in Early Dwarf Galaxies
This multi-panel figure, created with the eps_writer extension, highlights the magnitude and direction of the acceleration created by radiation pressure from massive stars in a dwarf galaxy at redshift 8. This simulation was presented in Wise et al. (2012) and conducted with Enzo. The bottom panels show the density, temperature, and metallicity of the same slice. This figure was published in the reference above as Figure 9.

Density and Temperature Around a Forming Star
This movie shows the density and temperature structure around a forming protostar that is surrounded by an accretion disk and driving a bipolar outflow. The simulation was carried out by S. Offner with the ORION code, the temperature was computed by T. Robitaille with the Hyperion radiative transfer code and the visualization was produced in Python using yt and matplotlib.
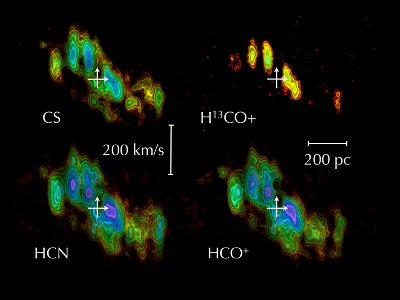
ALMA Data Cubes
yt was used to render images from ALMA datacubes of extragalactic sources as well as create the cover of the July 25 cover of Nature Magazine. For more information as well as movies (made with yt!) of the data, see the ALMA press release. (Images courtesy Erik Rosolowsky and the ALMA Observatory.)
Interactive Maps of the Local ISM
Lallement et al. 2013 used yt to extract surfaces from maps of the local interstellar medium to create interactive figures. These figures can be viewed either in the PDFs on the arXiv, or on Sketchfab. Threshold 0.004 and Threshold 0.00007.
Slice Plot of Magnetized White Dwarf Binary Merger
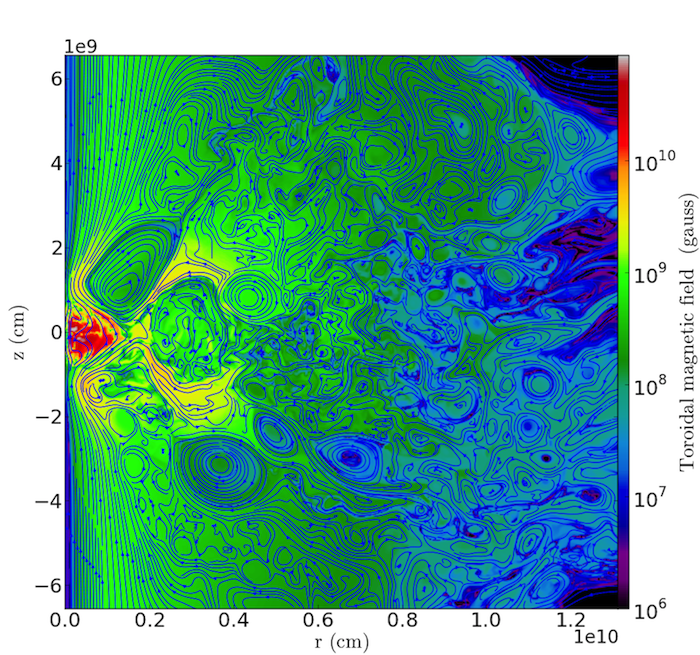
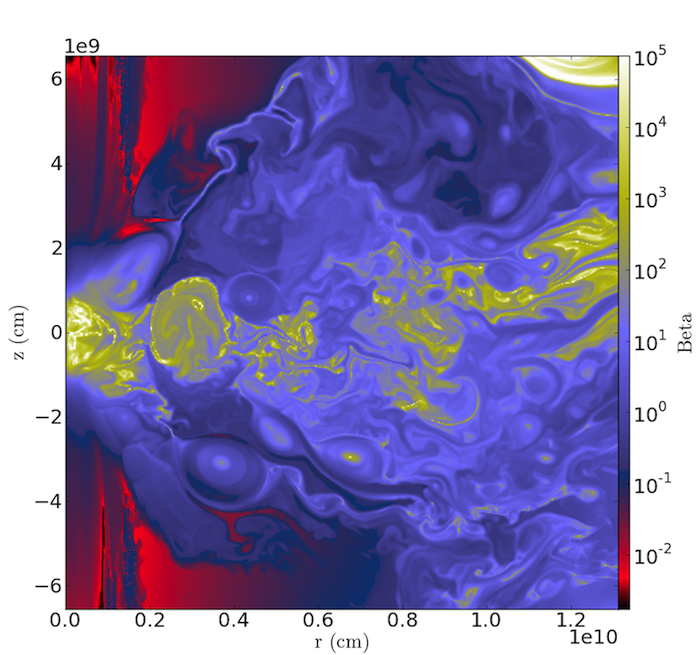
Figure 1(c) and 1(d) from Ji et al. (2013). Two frames in the r-z plane of cylindrical coordinate consisting of: Left) magnetic field, with lines of poloidal magnetic field in the r-z plane superposed against a color raster plot of the toroidal field; Right) the ratio of gas pressure to magnetic pressure β value. Figures generated with the yt slice plot.
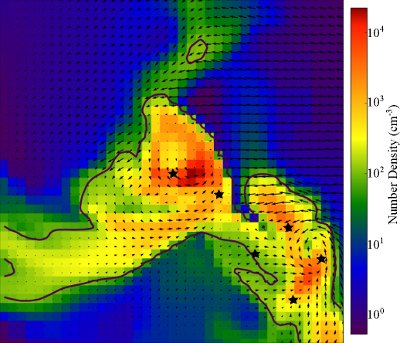
GMC Identification
A slice through the z-plane of a typical cloud from Benincasa et al. 2013. Image size is 300 pc, overlaid with vectors indicating local gas velocity and contours at number density of 100 cm^-3, indicating identified GMCs.
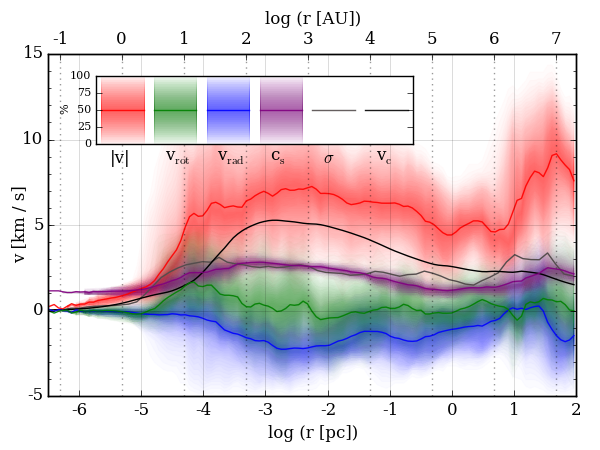
Velocity Structure of a Collapsing Cloud
Figure 10 from Smith et al. (2015). Radial profiles of the various components of the velocity field of a collapsing, metal-enriched gas-cloud. 2D profiles made with the yt halo analysis toolkit and image made with matplotlib.
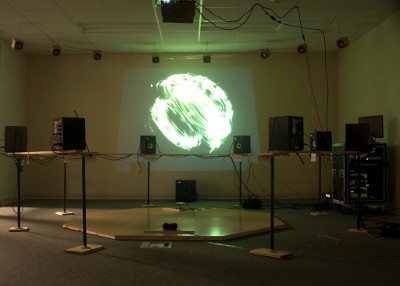
Seismology Visualization
yt has been used by researchers with the Seismic Sound Lab at the Lamont-Doherty Earth Observatory to create public outreach movies of earthquake simulations, which have been coordinated to match sonification of these simulations.
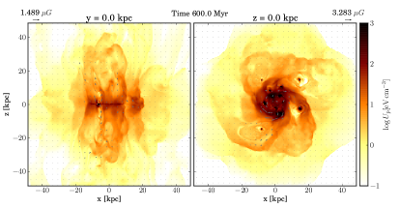
Slices of the Computational Domain
Figure 1b from Hanasz et al. (2013). Vertical (left panel) and horizontal slices (right panel) through the computational volume from the simulation of the cosmic ray driven outflows in gas-rich, high-redshift galaxies showing electron energy density. Data extracted using yt and visualized with matplotlib.
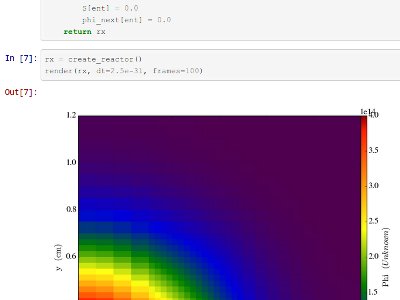
Neutron Diffusion with PyNE and yt
This notebook demonstrates construction of a simple neutron diffusion problem, using PyNE, yt, and the IPython notebook to solve and visualize the system in-memory. It constructs a semi-structured mesh in memory and then over the course of several timesteps updates the values and plots.
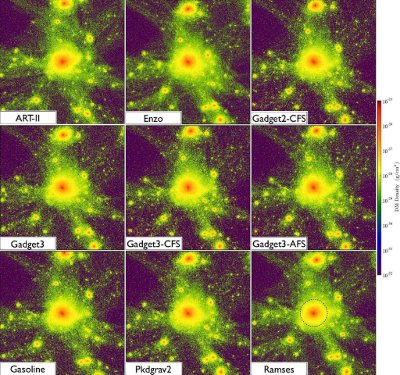
AGORA Project
The AGORA project is a suite of galaxy simulations conducted with multiple codes. The figures in Kim et al. 2013 were created with yt from data generated by many different simulation platforms, with scripts available in a publicly accessible repository.
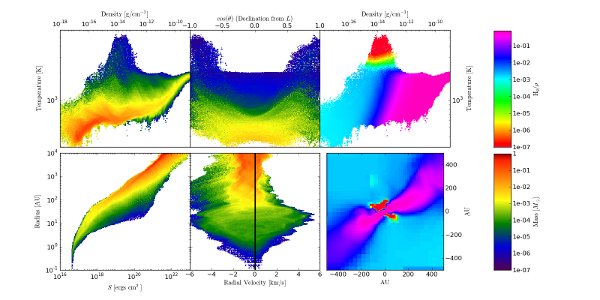
Entropy Distribution
This figure, from Turk et al. 2010, demonstrates using yt to construct derived fields for examining local angular momentum, entropy, and the distribution of molecular gas in protostellar disks.
Synthetic Observations of the Circumgalactic Medium
Figure 1 from Hummels et al. 2013 displays views of a galactic halo through synthetic observations of its circumgalactic medium in different ions. It uses yt to generate off-axis line integrals for computing the equilibrium metal abundances at every point along the line of sight and coadds these to produce a series of column density maps.

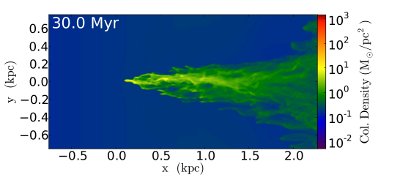
Formation of Compact Clusters
In Richardson et al. 2013, the authors studied the interaction between metal-enriched outflows and cosmological minihalos to examine the formation of clumps of dense, chemically-homogeneous star-forming gas.