yt is an open-source, permissively-licensed python package for analyzing and visualizing volumetric data.
yt supports structured, variable-resolution meshes, unstructured meshes, and discrete or sampled data such as particles. Focused on driving physically-meaningful inquiry, yt has been applied in domains such as astrophysics, seismology, nuclear engineering, molecular dynamics, and oceanography. Composed of a friendly community of users and developers, we want to make it easy to use and develop — we'd love it if you got involved!
import yt
ds = yt.load_sample("IsolatedGalaxy")
ds.r[0.45:0.55,:,:].sum("cell_mass").in_units("Mjup")
9.98537989593e+12 Mjup
import yt
ds = yt.load_sample("IsolatedGalaxy")
def thermal_energy_dens(field, data):
    return (3/2)*data['gas', 'number_density'] * data['gas', 'kT']
ds.add_field(("gas", "thermal_energy_density"), units="erg/cm**3",
             function=thermal_energy_dens, sampling_type="cell")
ad = ds.all_data()
ad.mean("thermal_energy_density", "z", weight="density").plot()

import yt
ds = yt.load("GasSloshing/sloshing_nomag2_hdf5_plt_cnt_0150",
             unit_system="imperial")
slc = yt.SlicePlot(ds, 'z', "temperature", width=(600,"kpc"))

import yt
ds = yt.load_sample("IsolatedGalaxy")
sp = ds.sphere([0.5, 0.5, 0.5], (8, "kpc"))
sp.save_as_dataset("my_sphere.h5", ["density", "particle_mass"])
ds2 = yt.load("my_sphere.h5")
print (ds2.data["particle_mass"].to("Msun"))
[ 213975.58440381
  213975.58440381
  213975.58440381
  ...,
  102714.05991054
  102857.70970906
  102981.94762343] Msun
import yt
ds = yt.load_sample("snapshot_033")
ds.r[(12.4, 'Mpc'),:,:].plot(("gas", "density"))

import yt
ds = yt.load_sample("D9p_500")
p = yt.ProjectionPlot(ds, "y", "density")

import yt
ds = yt.load_sample("IsolatedGalaxy")
yt.interactive_render(ds)

import yt
ds = yt.load_sample("snipshot_399_z000p000")
ad = ds.all_data()
yt.ProfilePlot(ad, ("PartType0", "density"),
               ("PartType0", "temperature"),
               weight_field = ("PartType0", "particle_mass")).save()

import yt
ds = yt.load_sample("HiresIsolatedGalaxy")
ad = ds.all_data()
yt.PhasePlot(ad, "density", "temperature", "cell_mass",
             weight_field=None).save()

import yt
ds = yt.load_sample("Enzo_64/DD0043/data0043")
ds.r[:].min(), ds.r[:].max()
(3.81289338015e-32 g/cm**3,
 6.27892369905e-27 g/cm**3)
import yt
ds = yt.load_sample("output_00080")
ds.r[(10.0, "Mpc"):(20.0, "Mpc"),
     (30.0, "Mpc"):(40.0, "Mpc"),
     (50.0, "Mpc"):(60.0, "Mpc")].mean("temperature", weight="density")
296317.62046 K
import yt
ds = yt.load_sample("IsolatedGalaxy")
loc1 = ds.r[:].argmax("temperature")
loc2 = ds.r[:].argmax("density")
ray = ds.ray(loc1, loc2)
ray["velocity_magnitude"].in_units("cm/s")
YTArray([ 22921344.10593038,
          24626806.46165072,
          24759784.32406003,
          26583519.63858156,
          27331481.53657745,
          27728742.61474814,
          28734604.40420894,
          30188600.75890669,
          30989266.0493723 ,
          31197303.98155414,
          ...
          10846216.93678336,
          12222078.64819527]) cm/s
Learn: getting started.
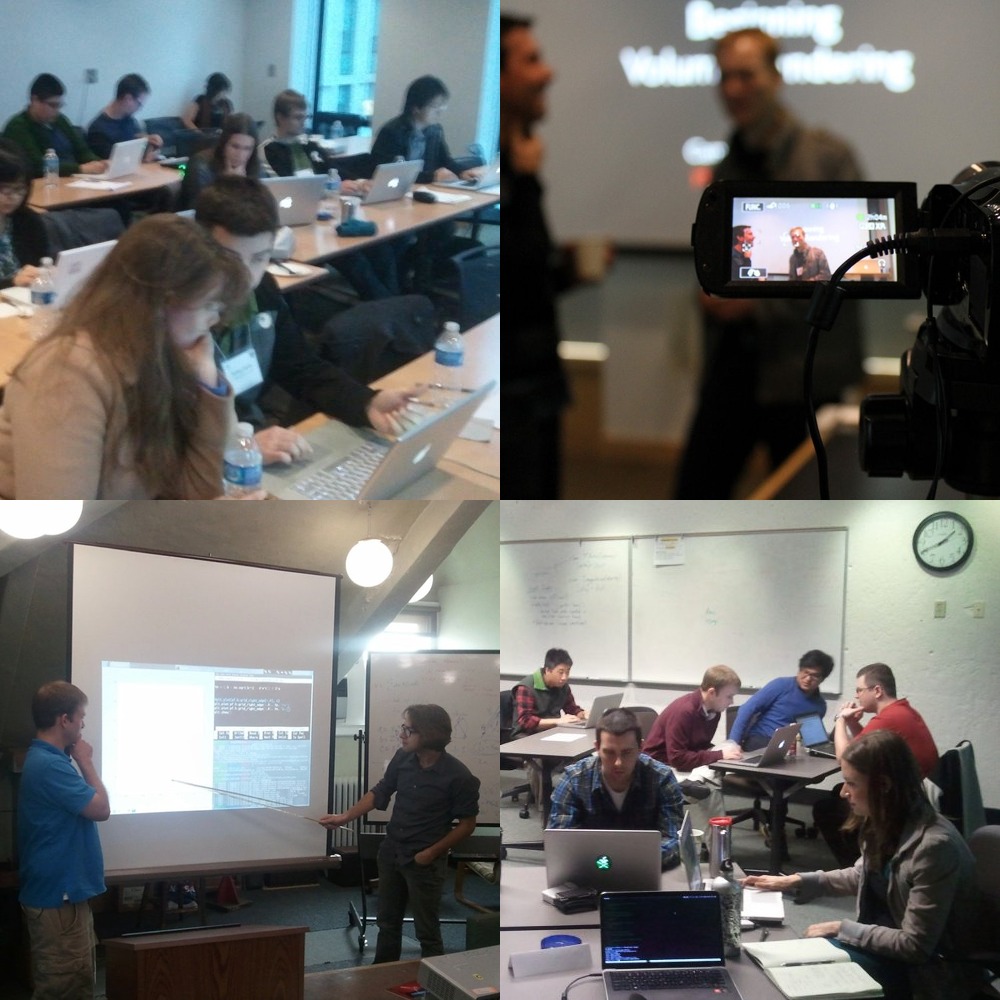
To get started using yt to explore data, we provide resources including documentation, workshop material, and even a fully-executable quick start guide demonstrating many of yt's capabilities.
But if you just want to dive in and start using yt, we have a long list of recipes demonstrating how to do various tasks in yt. We even have sample datasets from all of our supported codes on which you can test these recipes. While yt should just work with your data, here are some instructions on loading in datasets from our supported codes and formats.
Community: yt's best feature.
yt is a friendly community. We like hearing about fun things you have done with the code, and we're happy to help you out if you have a question or some trouble. You can join us on the mailing lists, and if you'd like, you can check out how to develop, too.
If you've got some code to share, or scripts that you'd like to share, start up a repo on GitHub or Bitbucket or share them on our pastebin. If you have any trouble, drop by the mailing list and we'll be happy to help out.
Participatory development.
If you're interested in getting started with helping out, the easiest way is to Fork us on GitHub, check out the developer guide, and stop by the development mailing list. yt is released under the modified BSD License.
There are lots of fun projects to work on, along with some open issues, and we'd particularly like if you'd help out by adding support for a a new data format or if you'd like to help out by shoring up support for a semi-supported output format.
Get yt: overview.
yt is built on a stack of completely free and libre open source software, with no proprietary dependencies and is distributed to both the conda and PyPi package repositories for easy installation. For a full description of how to install, including selecting optional dependencies and installing from source, see the main documentation.
If you use yt in a publication, we request that you please consider citing our method paper (BibTeX).
Get yt: using conda.
If you use the anaconda python distribution or use conda to manage python packages, you can install the latest stable version of yt with the following command:
Or a nightly development build:
Get yt: using pip.
You can also can install the latest stable version of yt via pip with:
See here for more details on installation.